Uploads by Jmcmulli
From EVLA Guides
Jump to navigationJump to search
This special page shows all uploaded files.
| Date | Name | Thumbnail | Size | Description | Versions |
|---|---|---|---|---|---|
| 22:33, 13 July 2011 | APIwind June.png (file) |  |
134 KB | 1 | |
| 22:17, 13 July 2011 | APIwind December.png (file) |  |
127 KB | 1 | |
| 22:17, 13 July 2011 | APIwind November.png (file) | 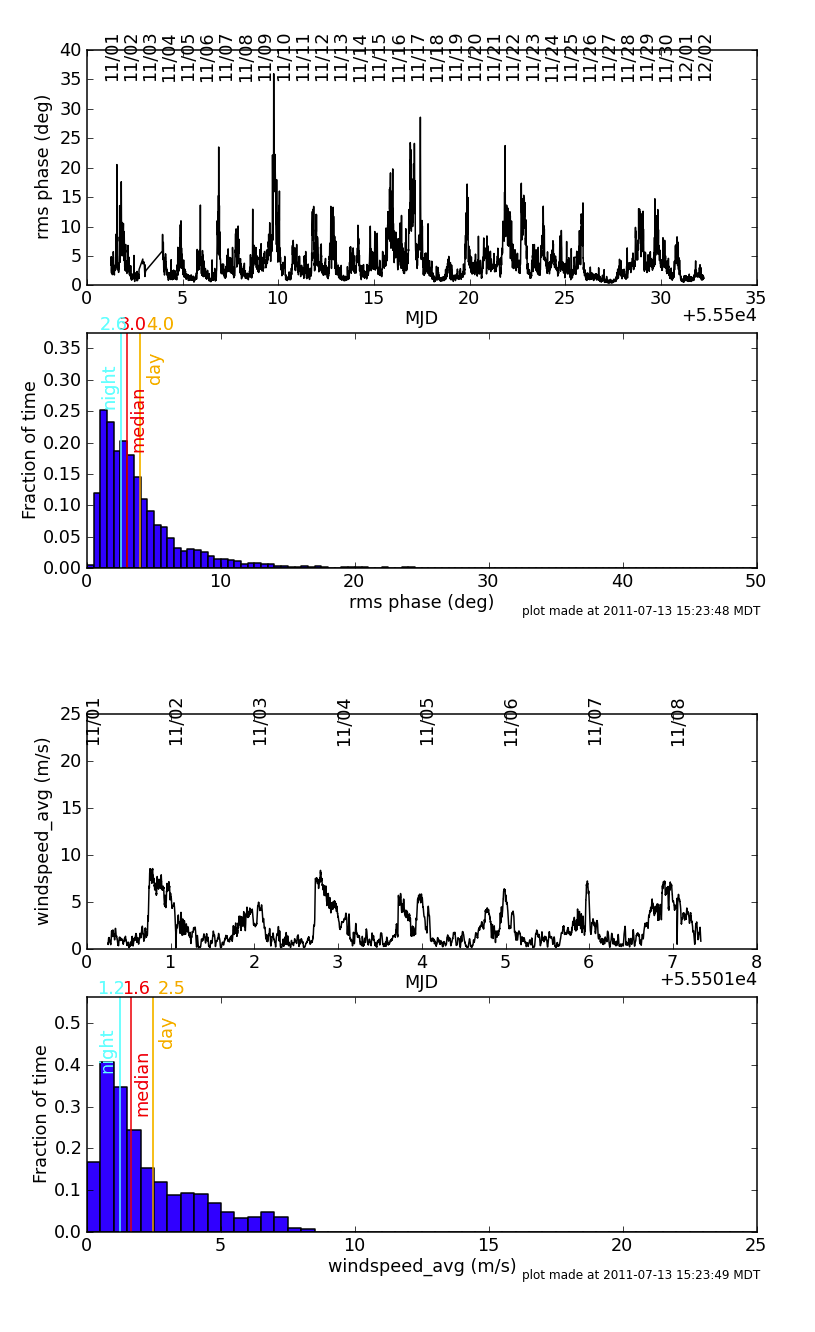 |
127 KB | 1 | |
| 22:16, 13 July 2011 | APIwind October.png (file) | 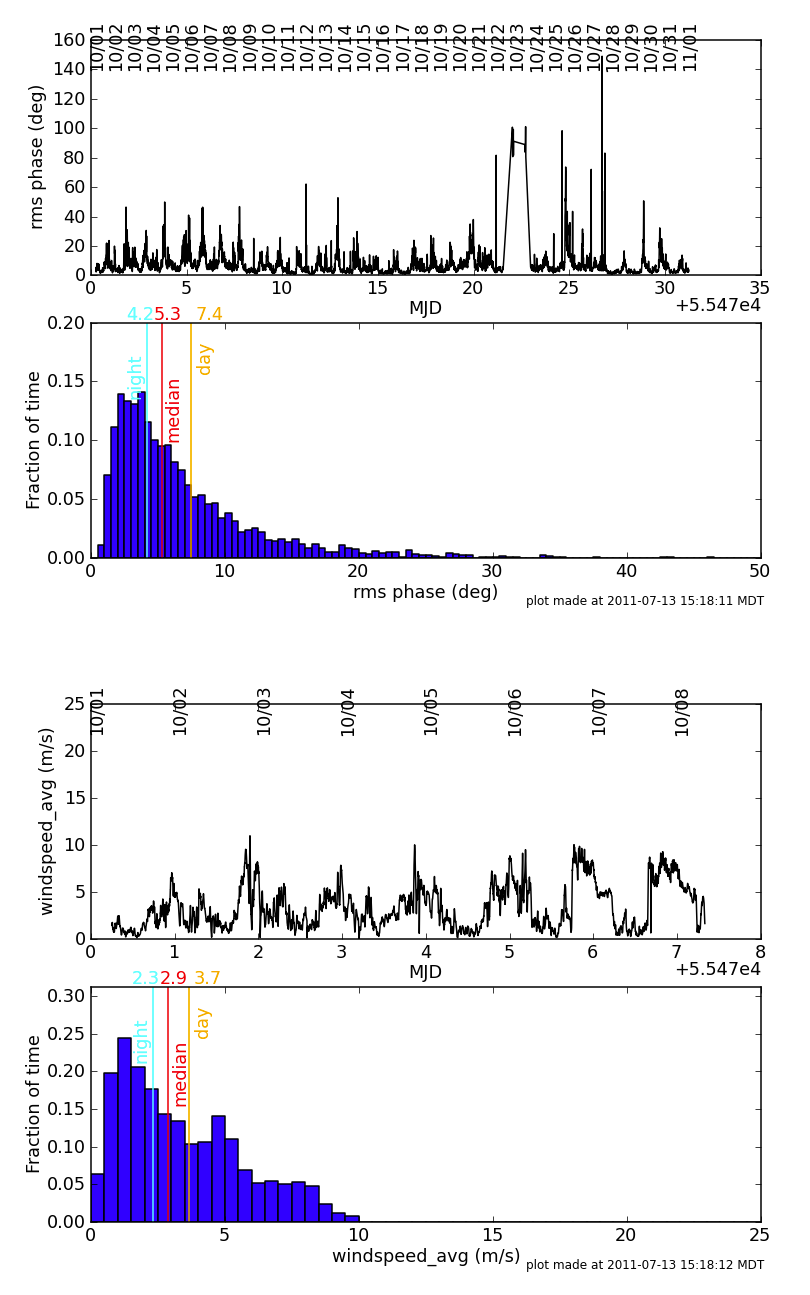 |
128 KB | 1 | |
| 22:16, 13 July 2011 | APIwind September.png (file) | 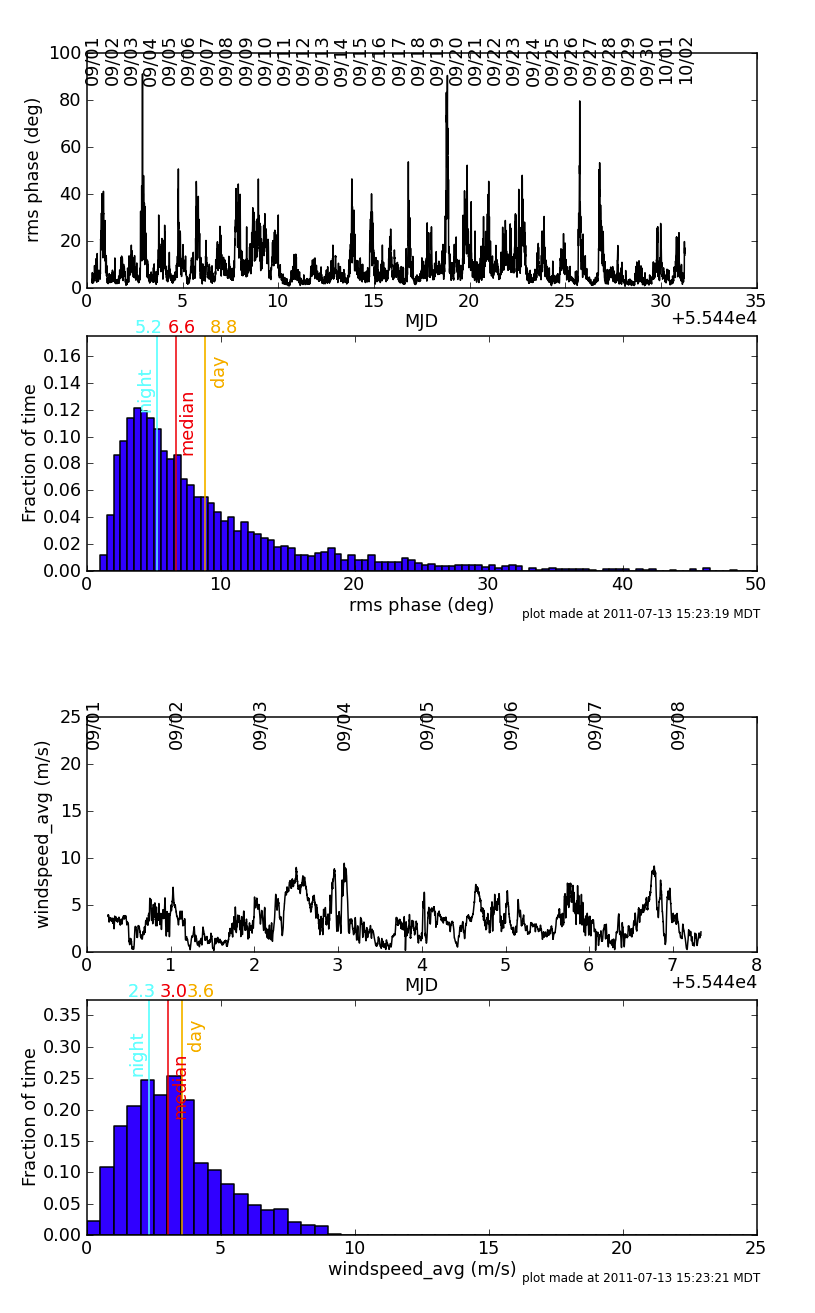 |
136 KB | 1 | |
| 22:16, 13 July 2011 | APIwind August.png (file) | 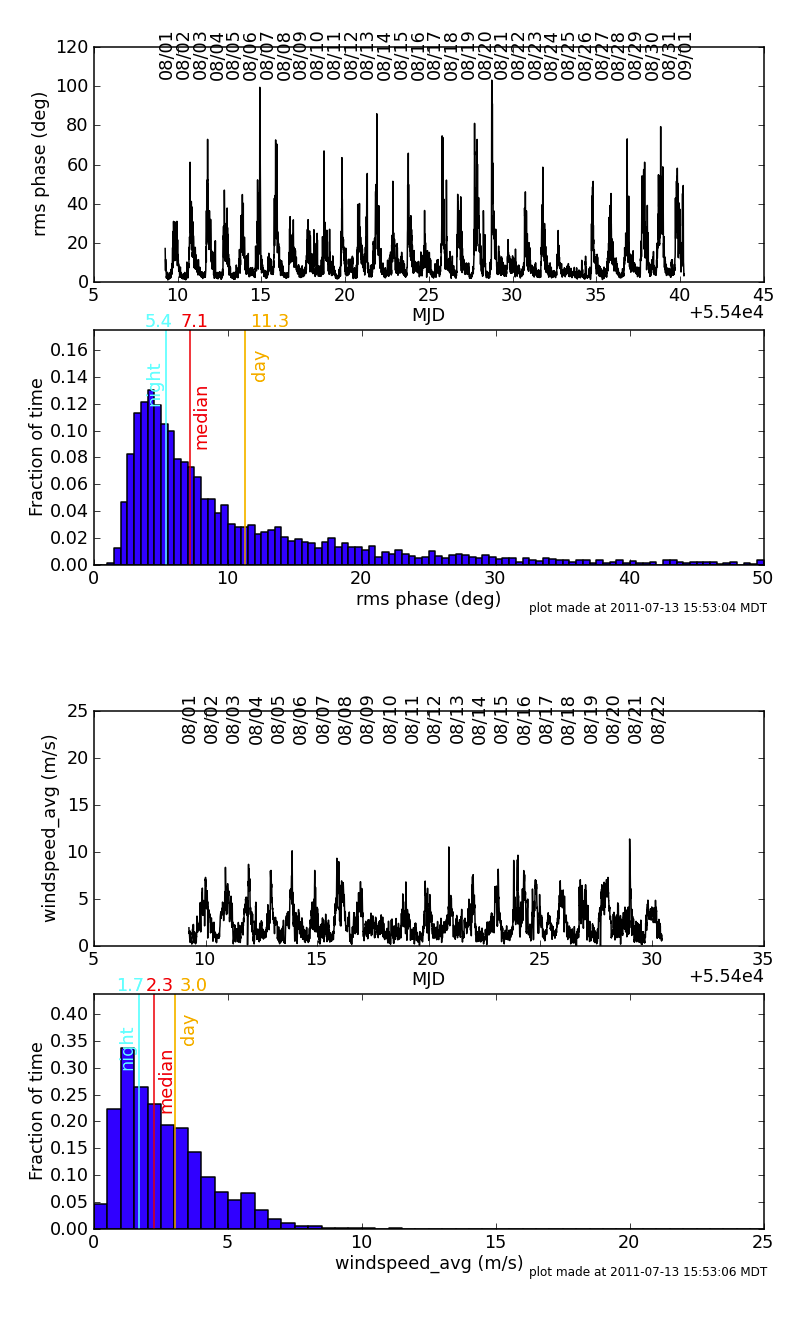 |
136 KB | 1 | |
| 22:15, 13 July 2011 | APIwind May.png (file) |  |
136 KB | 1 | |
| 22:15, 13 July 2011 | APIwind April.png (file) | 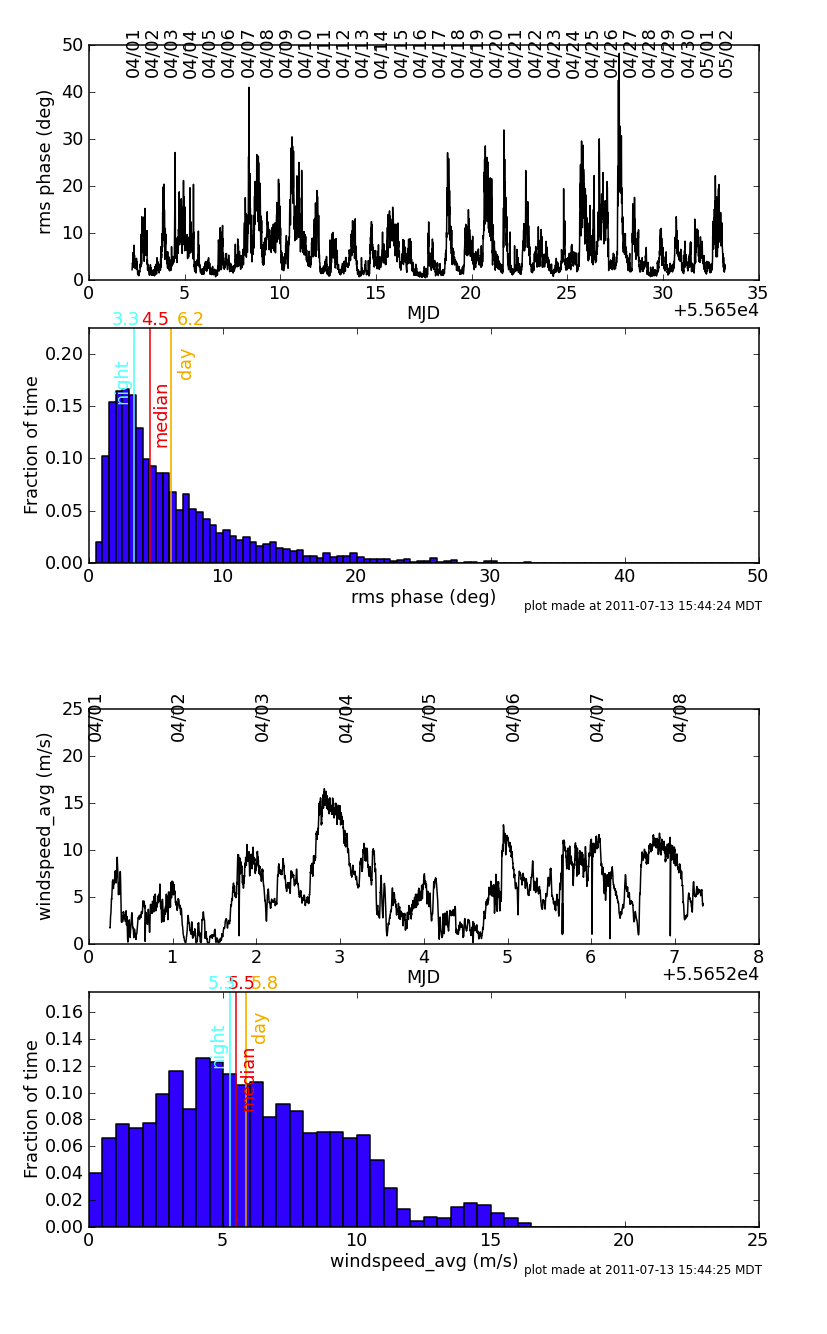 |
139 KB | 1 | |
| 22:14, 13 July 2011 | APIwind March.png (file) | 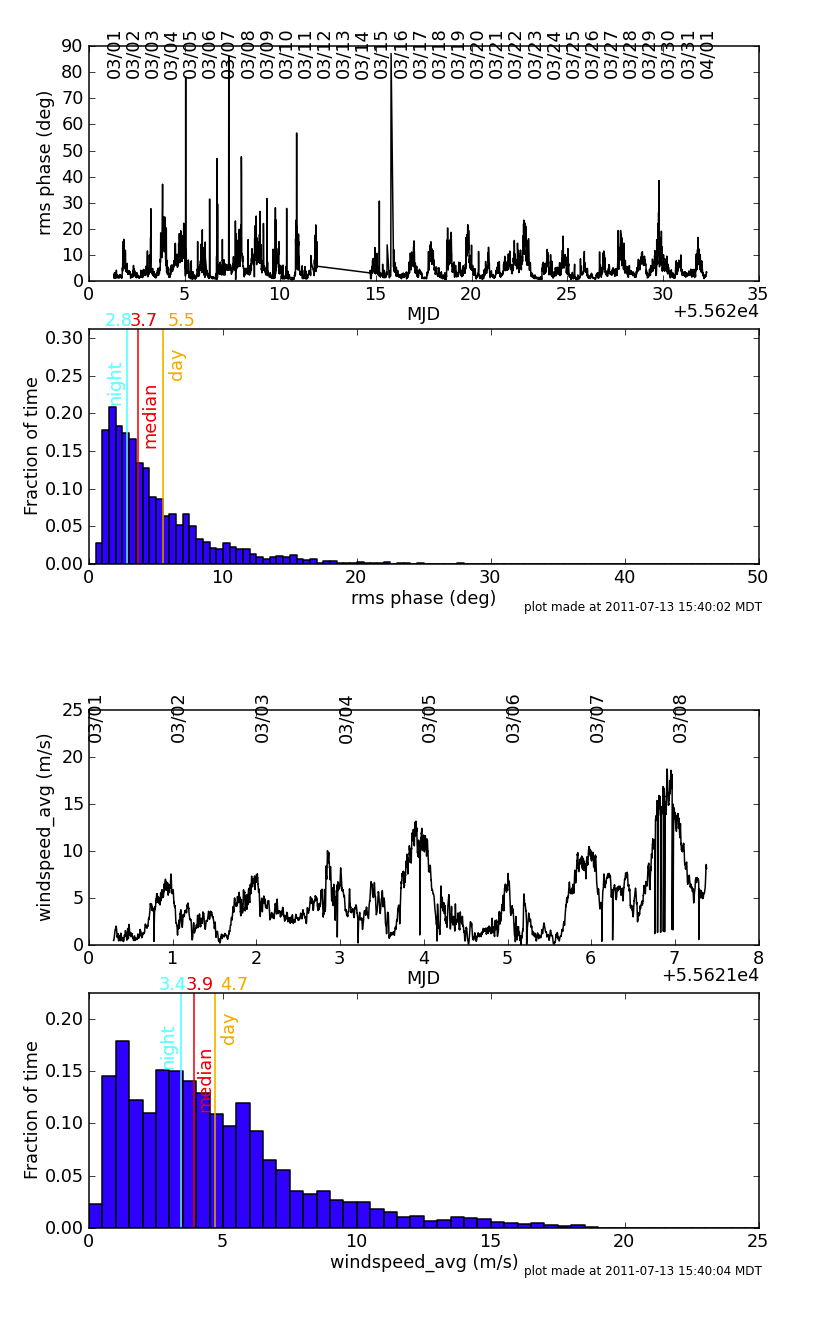 |
131 KB | 1 | |
| 22:14, 13 July 2011 | APIwind February.png (file) | 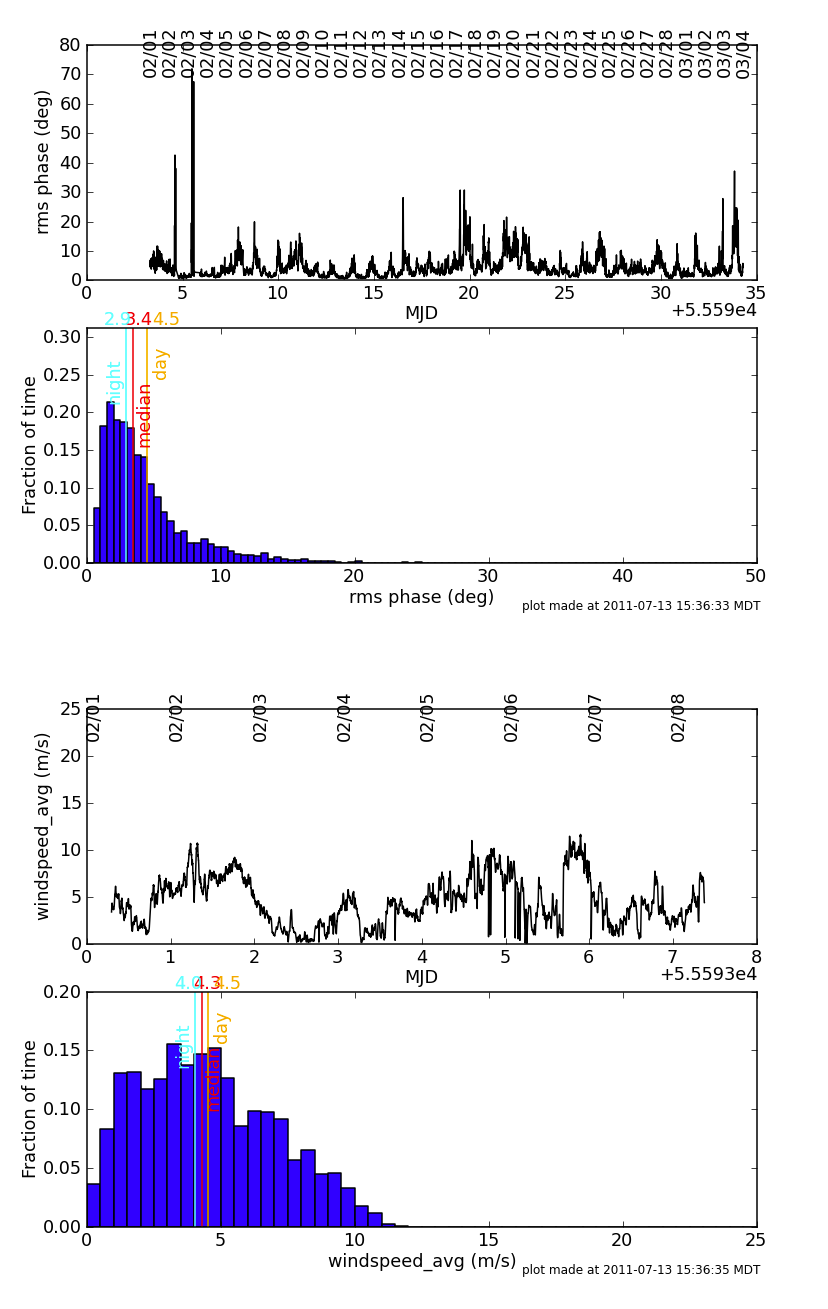 |
126 KB | 2 | |
| 22:13, 13 July 2011 | APIwind January.png (file) | 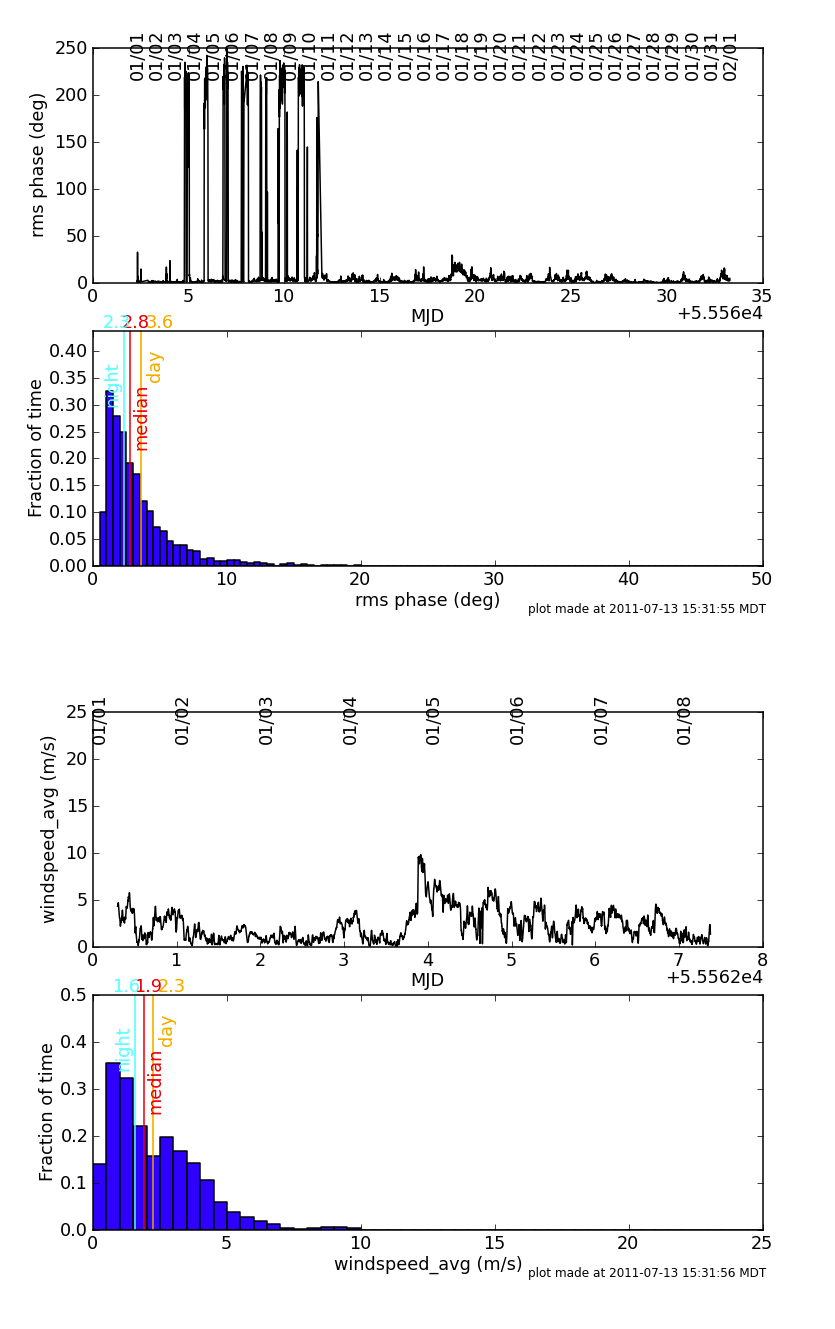 |
121 KB | 1 | |
| 00:36, 30 June 2011 | SEFD.png (file) | 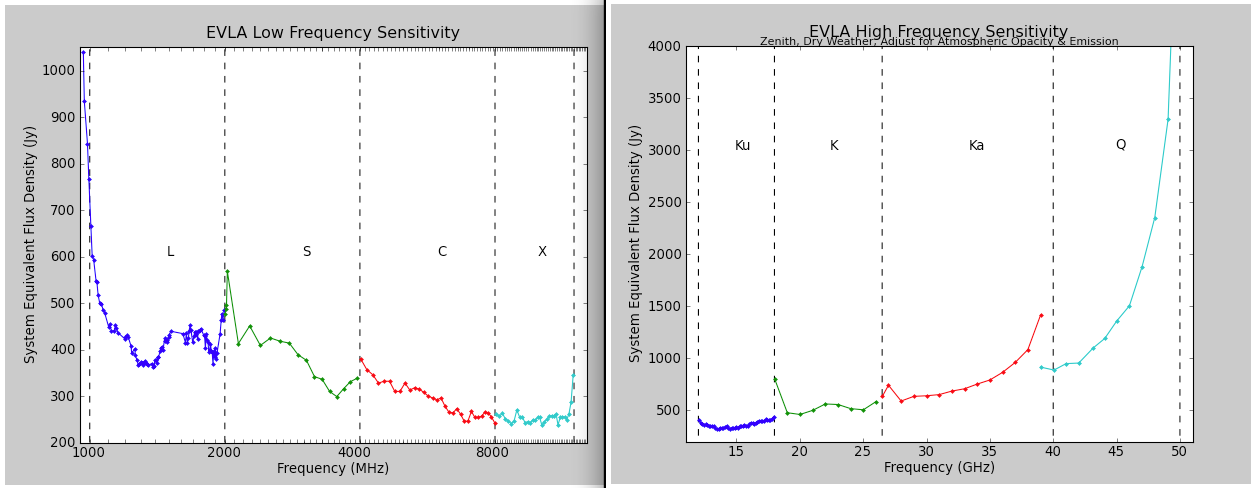 |
81 KB | 4 | |
| 15:14, 29 June 2011 | WideBandRcvrFrcstDec10.png (file) | 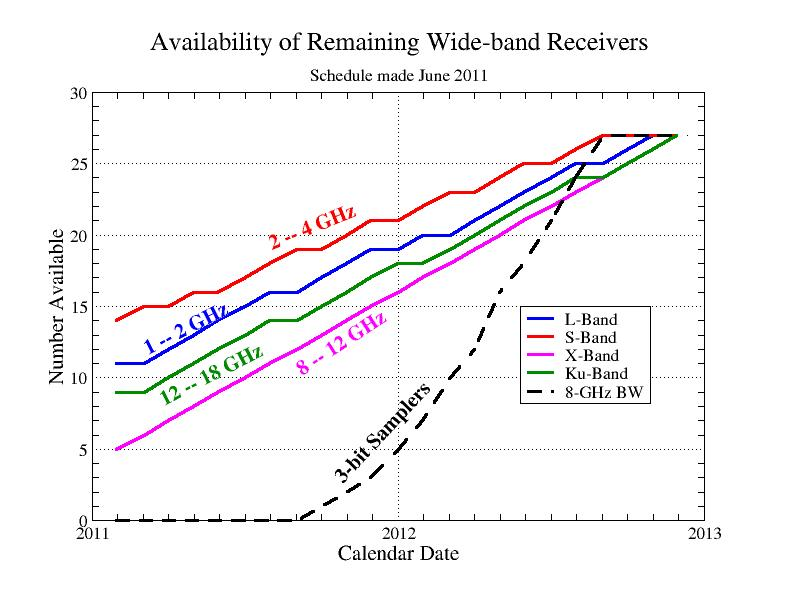 |
214 KB | June 2011 update; includes 3-bit sampler schedule. | 2 |
| 17:58, 22 September 2010 | 4-bandResponse.png (file) | 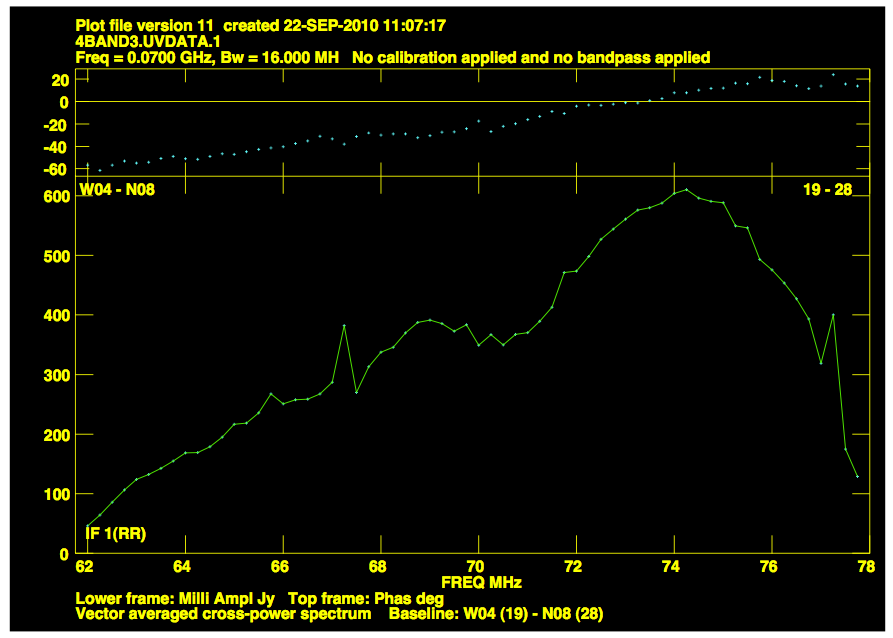 |
68 KB | Plot of the frequency response of Cygnus A observed with WIDAR over a 16 MHz bandpass on one representative baseline. The response peaks at 74 MHz but has signal over 16 MHz; at the upper under the response is limited by a ~14 MHz filter centered at 70 MH | 1 |
| 22:35, 1 September 2010 | WideBandRcvrFrcstMay10.png (file) | 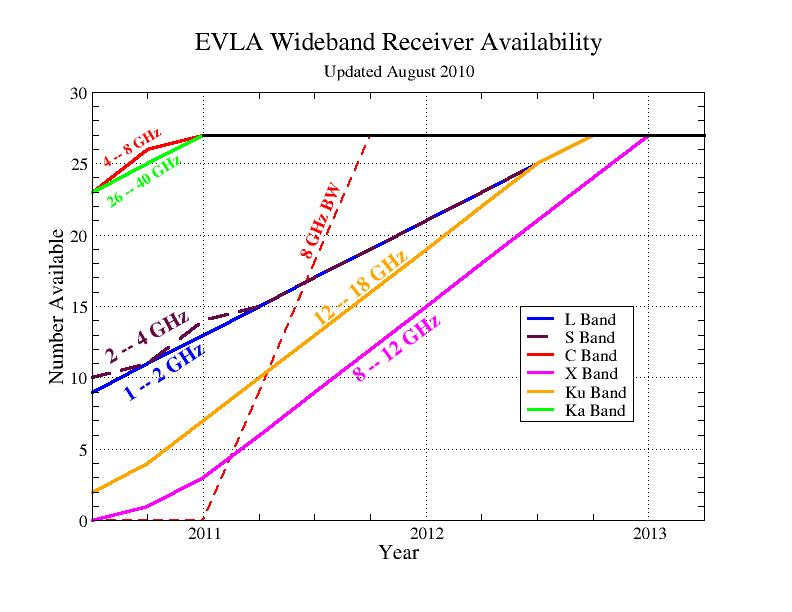 |
1.39 MB | Updated to August 2010. | 2 |
| 15:50, 14 April 2010 | Thermalnoise.png (file) | 11 KB | 1 | ||
| 15:41, 14 April 2010 | MHI.png (file) | 9 KB | 1 | ||
| 15:40, 14 April 2010 | BrightnessTemp.png (file) | 8 KB | 1 | ||
| 15:08, 14 April 2010 | Lband sweep.png (file) | 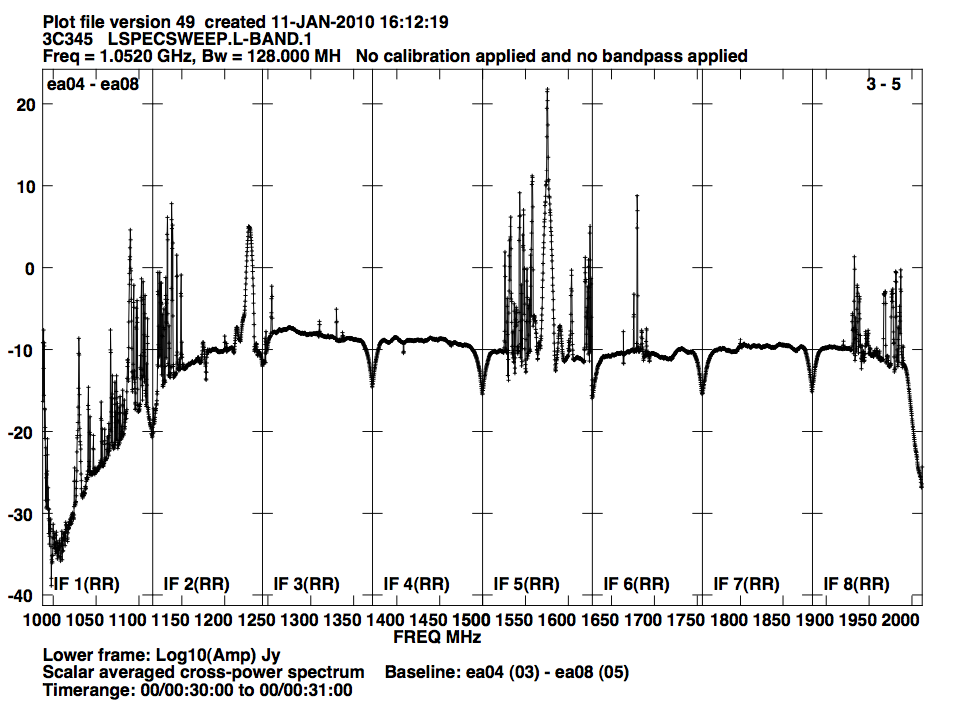 |
127 KB | Figure 3: Spectrum of L-band RFI. This shows the major interfering signals seen across the full 1 GHz bandwidth available to the L-band receivers. Each of the eight “spectral windows” displays 128 MHz from a separate sub-band. These are raw data, unca | 1 |
| 15:01, 14 April 2010 | S-bandRFI.png (file) | 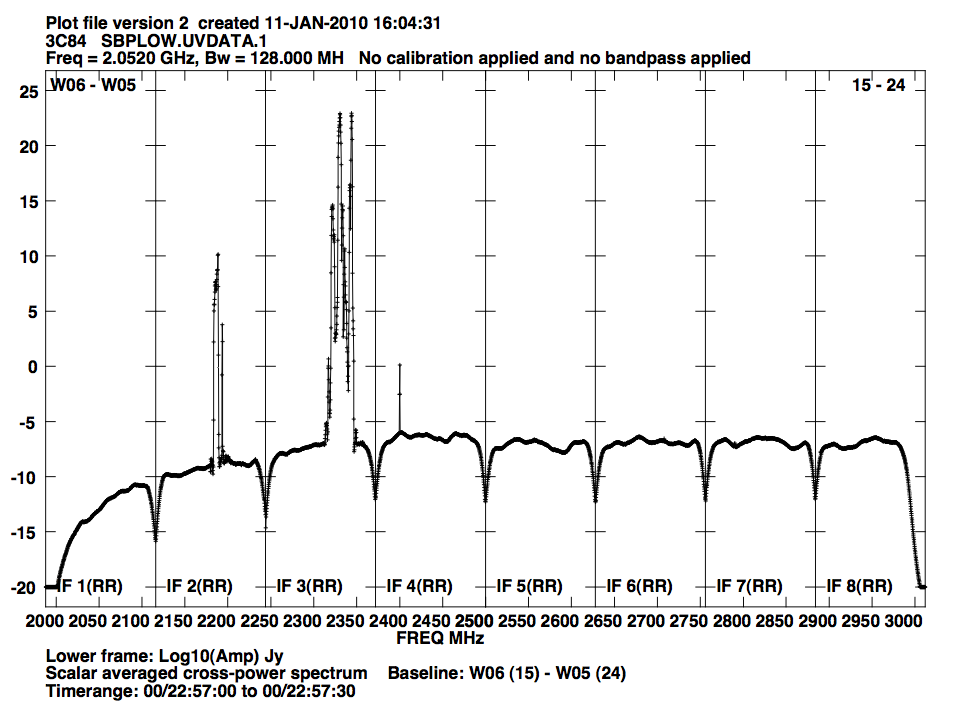 |
104 KB | This shows the raw spectrum of the lower half of S- Band – 2.0 to 3.0 GHz. No significant RFI is seen in the upper half. The major interference at 2.35 GHz is from satellite radio. | 1 |
| 20:47, 13 April 2010 | EVLA WidebandRxAvailability.png (file) | 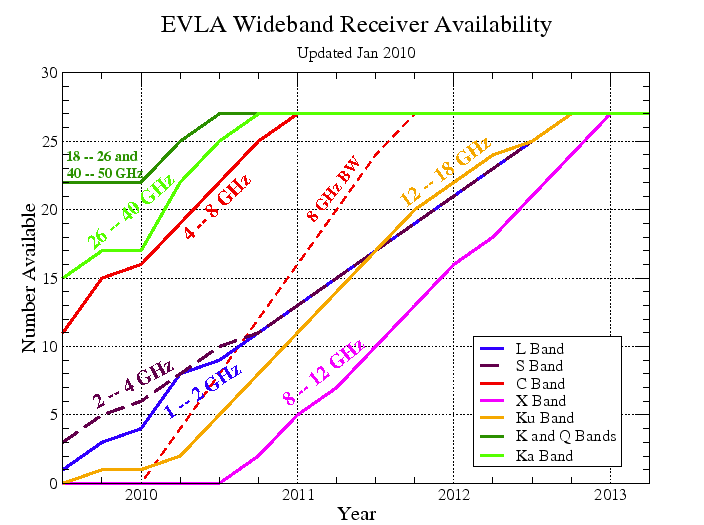 |
41 KB | Figure 1: EVLA Receiver Deployment Plan. Above is a plot of the availability of the final EVLA receivers from late 2009 until the end of the EVLA Construction Project in 2012. Only final EVLA receivers are shown. Interim receivers with reduced frequency c | 1 |
| 23:30, 12 April 2010 | OrionA Kspectrum.png (file) | 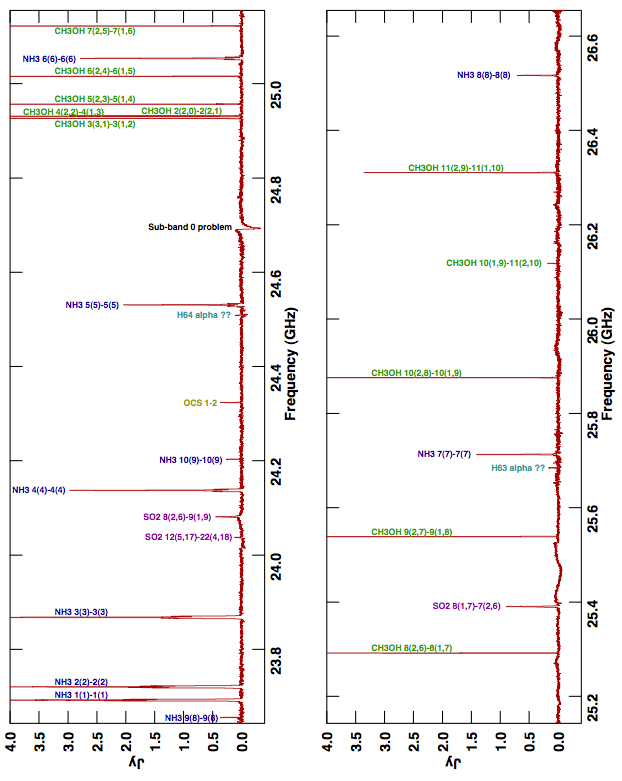 |
98 KB | 1 | |
| 14:54, 8 April 2010 | Vla panorama lo.jpg (file) | 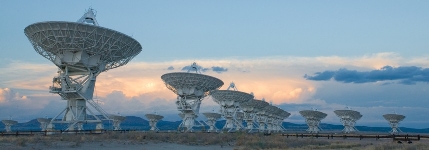 |
50 KB | 1 | |
| 14:44, 8 April 2010 | Book.gif (file) |  |
1 KB | 2 |