File list
From EVLA Guides
Jump to navigationJump to search
This special page shows all uploaded files.
| Date | Name | Thumbnail | Size | User | Description | Versions |
|---|---|---|---|---|---|---|
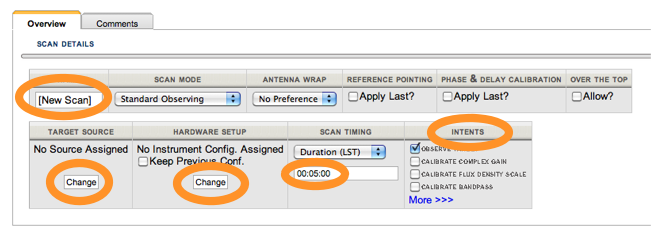
| 12:35, 13 April 2012 | New scan.png (file) |  |
85 KB | Akepley | 2 | |
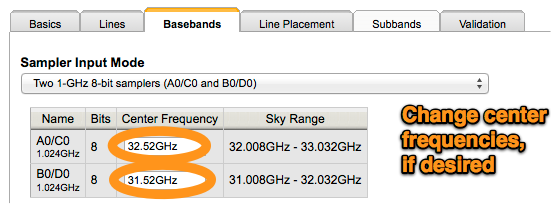
| 12:10, 1 September 2011 | Rx May2011.png (file) |  |
84 KB | Thunter | 1 | |
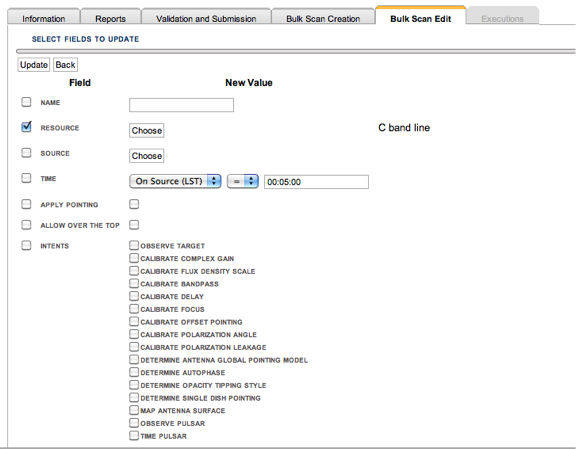
| 12:29, 13 April 2012 | Bulk scan edit change.png (file) |  |
83 KB | Akepley | 1 | |
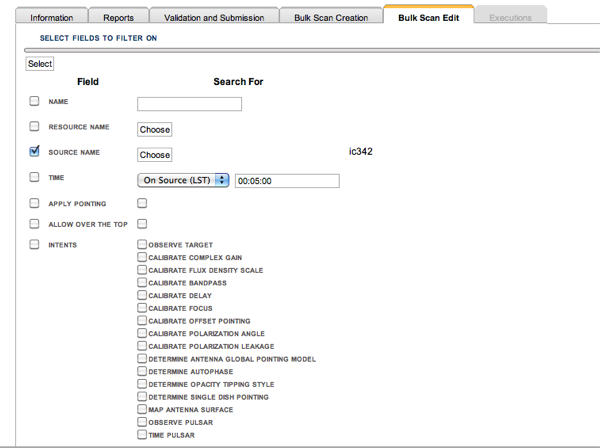
| 12:30, 13 April 2012 | Bulk scan edit select.png (file) |  |
82 KB | Akepley | 1 | |
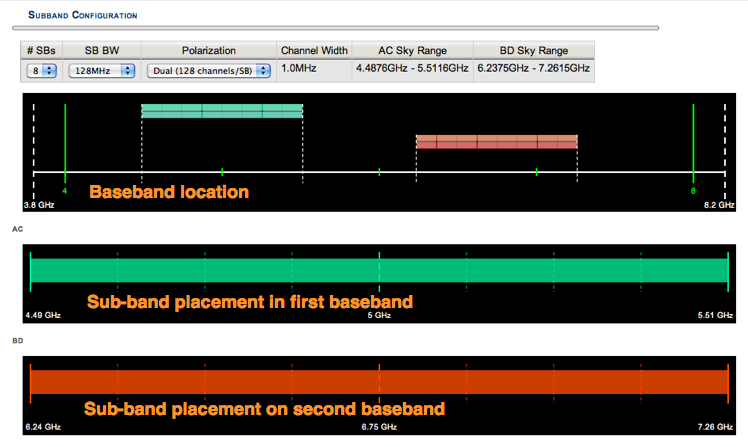
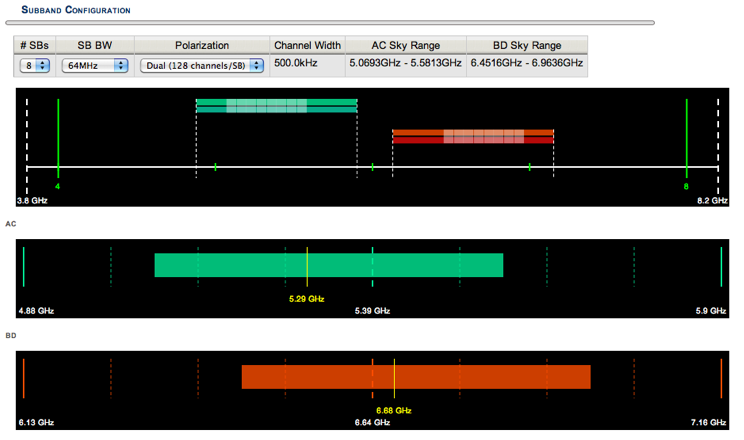
| 19:07, 11 April 2012 | Subband configuration.png (file) |  |
81 KB | Akepley | 1 | |
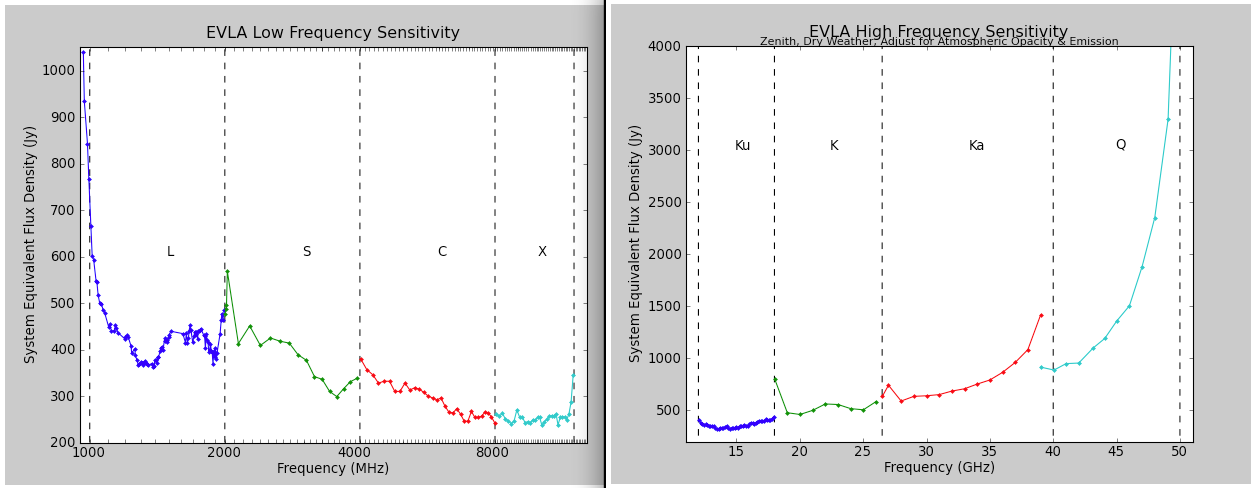
| 20:36, 29 June 2011 | SEFD.png (file) |  |
81 KB | Jmcmulli | 4 | |
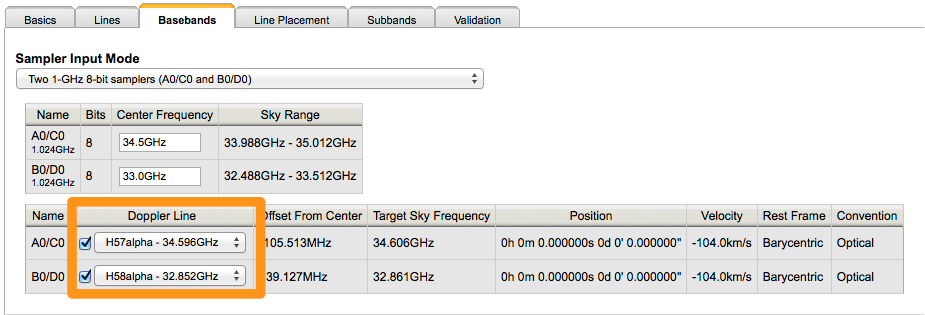
| 09:22, 25 January 2013 | Spectral line correlator doppler.png (file) |  |
80 KB | Akepley | 1 | |
| 12:02, 1 September 2011 | Rx November2010.png (file) |  |
79 KB | Thunter | 1 | |
| 12:33, 13 April 2012 | Doppler setting source selection.png (file) |  |
78 KB | Akepley | 1 | |
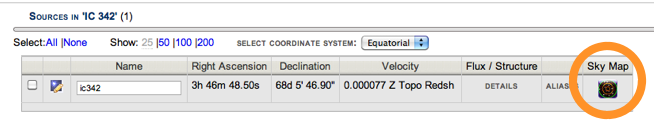
| 12:46, 13 April 2012 | Source overview.png (file) |  |
78 KB | Akepley | 1 | |
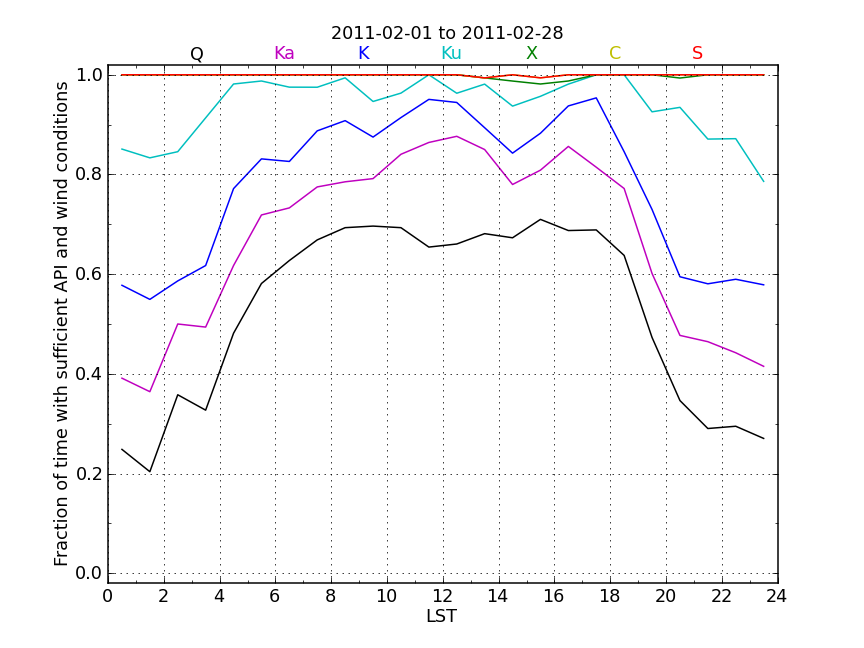
| 12:00, 1 September 2011 | Rx February2011.png (file) |  |
78 KB | Thunter | 1 | |
| 12:02, 1 September 2011 | Rx December2010.png (file) |  |
74 KB | Thunter | 1 | |
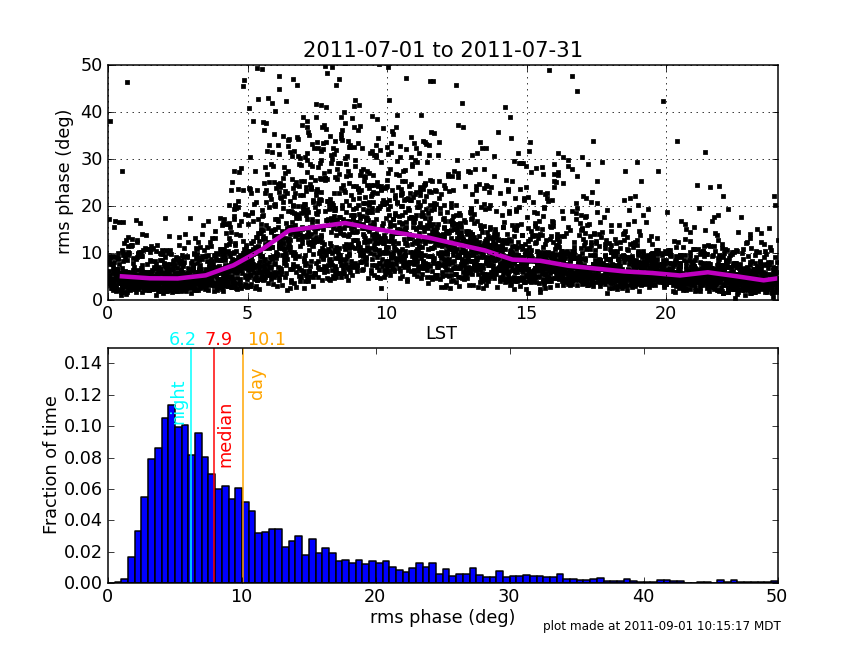
| 12:18, 1 September 2011 | Rmsphase July2011.png (file) |  |
74 KB | Thunter | 2 | |
| 18:51, 24 January 2013 | Spectral line correlator generate spws.png (file) | 74 KB | Akepley | 1 | ||
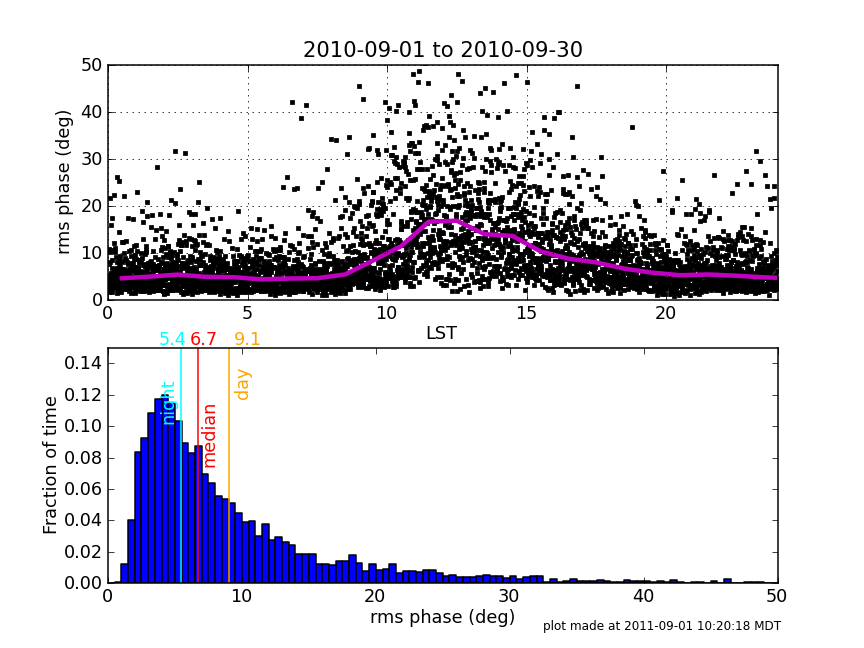
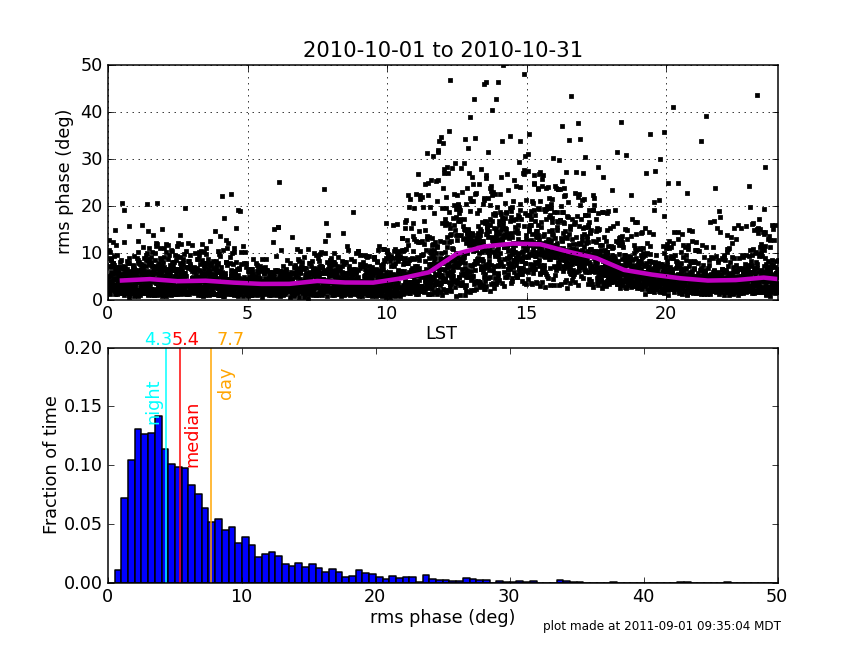
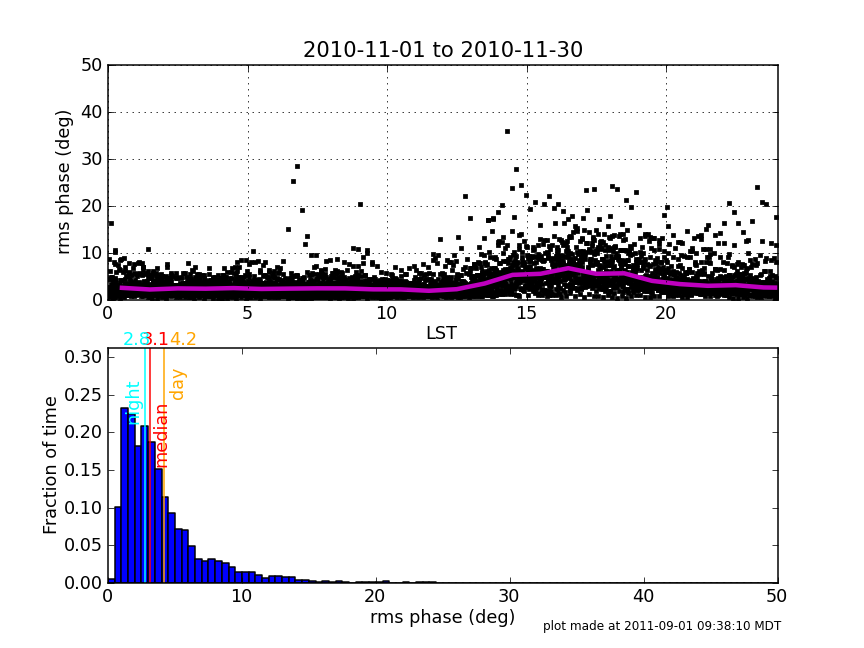
| 12:21, 1 September 2011 | Rmsphase September2010.png (file) |  |
73 KB | Thunter | 2 | |
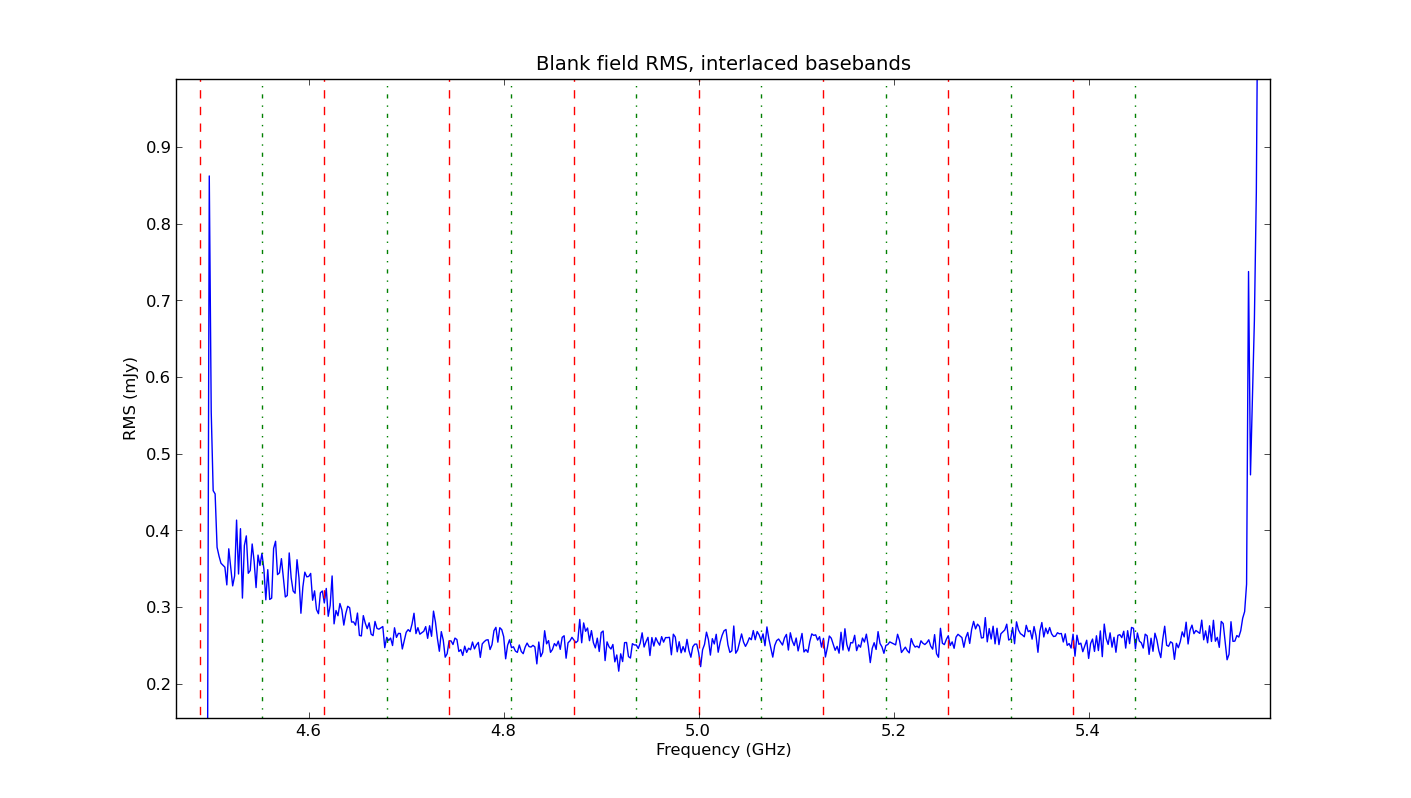
| 23:44, 6 March 2012 | BlankFieldRMS.interlace.png (file) |  |
72 KB | Jott | 1 | |
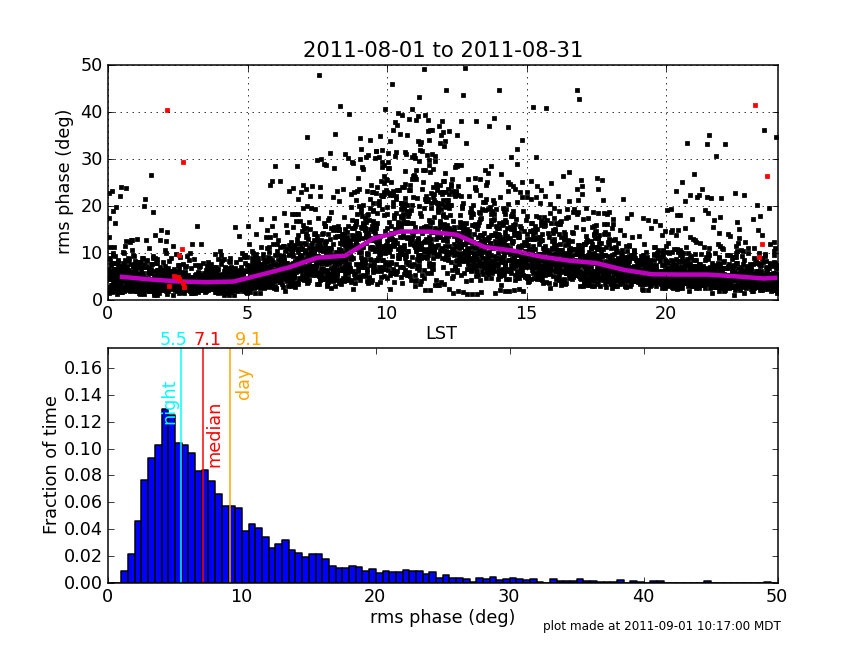
| 12:19, 1 September 2011 | Rmsphase August2011.png (file) |  |
71 KB | Thunter | 2 | |
| 12:51, 1 September 2011 | Rx January2011.png (file) |  |
71 KB | Thunter | 2 | |
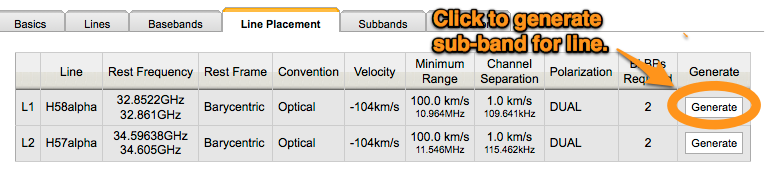
| 12:54, 13 April 2012 | Subband configuration line.png (file) |  |
70 KB | Akepley | 1 | |
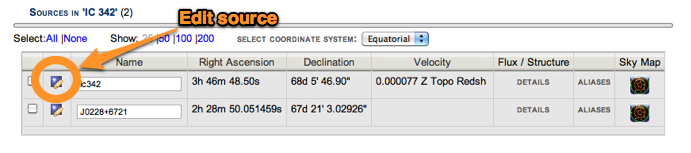
| 12:44, 13 April 2012 | Source edit button.png (file) | 69 KB | Akepley | 1 | ||
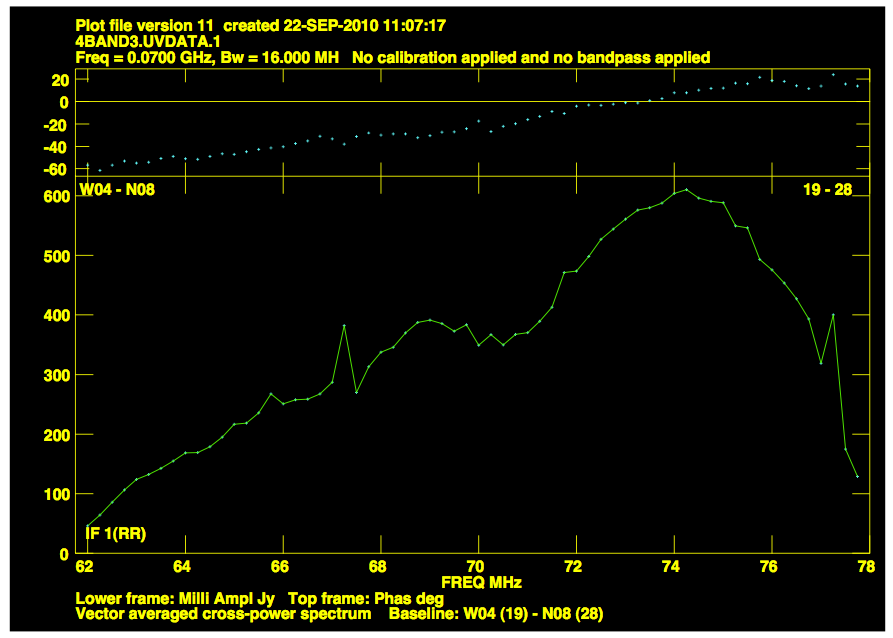
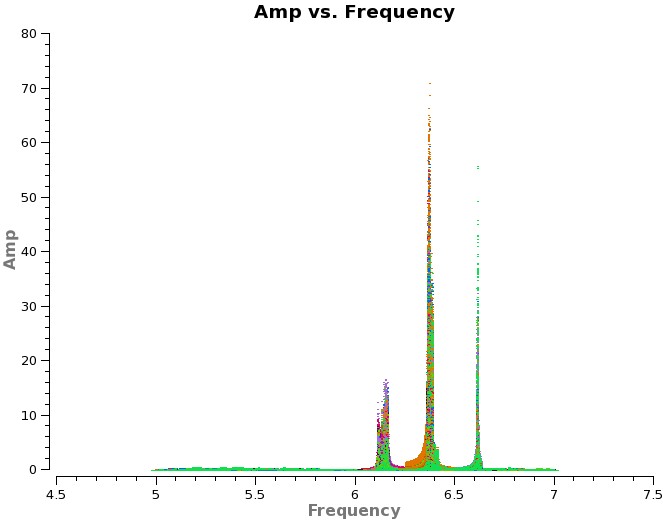
| 13:58, 22 September 2010 | 4-bandResponse.png (file) |  |
68 KB | Jmcmulli | Plot of the frequency response of Cygnus A observed with WIDAR over a 16 MHz bandpass on one representative baseline. The response peaks at 74 MHz but has signal over 16 MHz; at the upper under the response is limited by a ~14 MHz filter centered at 70 MH | 1 |
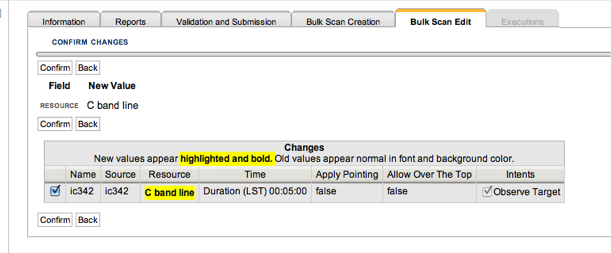
| 12:29, 13 April 2012 | Bulk scan edit confirm.png (file) |  |
68 KB | Akepley | 1 | |
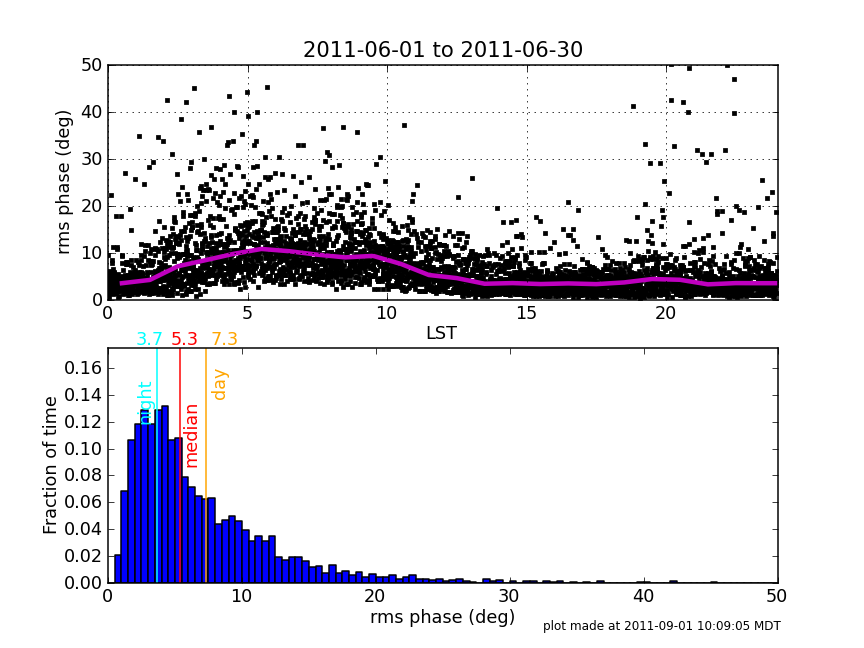
| 12:11, 1 September 2011 | Rmsphase June2011.png (file) |  |
68 KB | Thunter | 2 | |
| 23:23, 6 March 2012 | WIDARcorrelatorbands.png (file) |  |
68 KB | Jott | schematic WIDAR bands | 1 |
| 11:52, 1 September 2011 | Rmsphase October2010.png (file) |  |
65 KB | Thunter | 1 | |
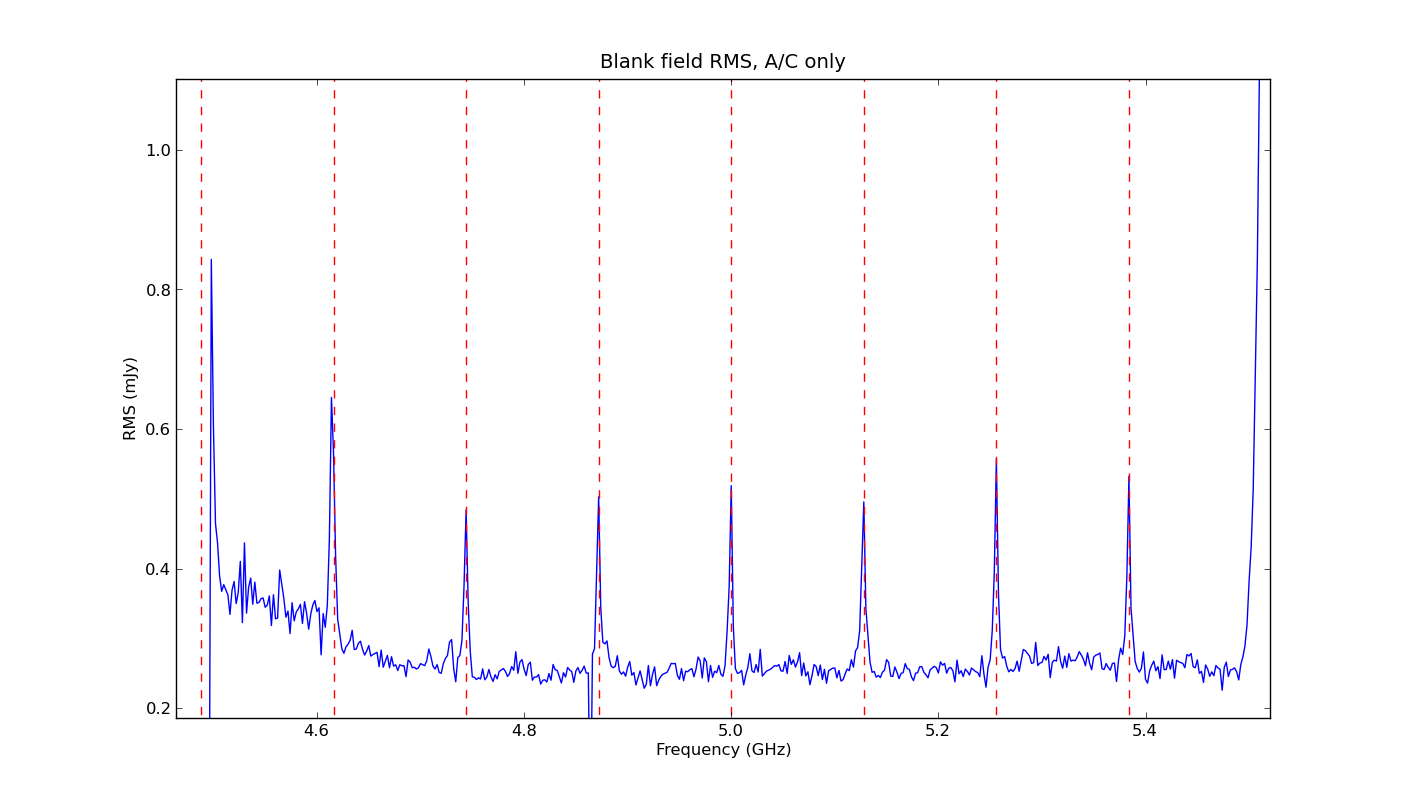
| 23:45, 6 March 2012 | BlankFieldRMS.AC.png (file) |  |
64 KB | Jott | 1 | |
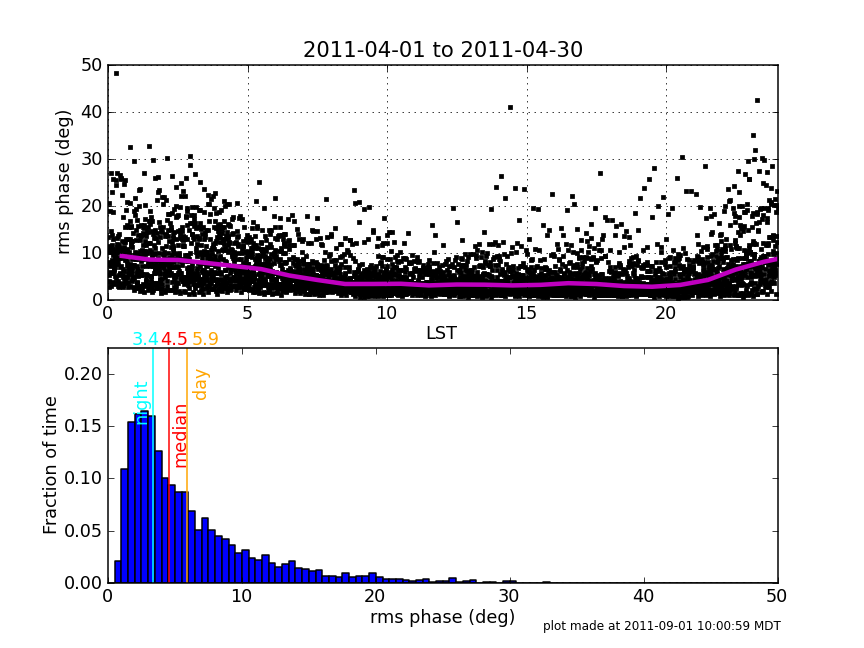
| 12:03, 1 September 2011 | Rmsphase April2011.png (file) |  |
64 KB | Thunter | 2 | |
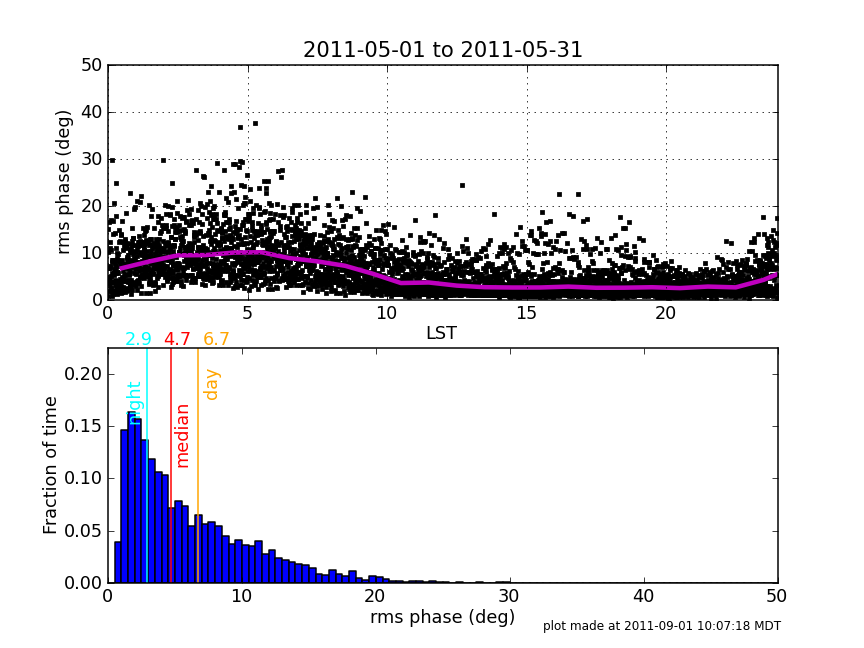
| 12:09, 1 September 2011 | Rmsphase May2011.png (file) |  |
63 KB | Thunter | 2 | |
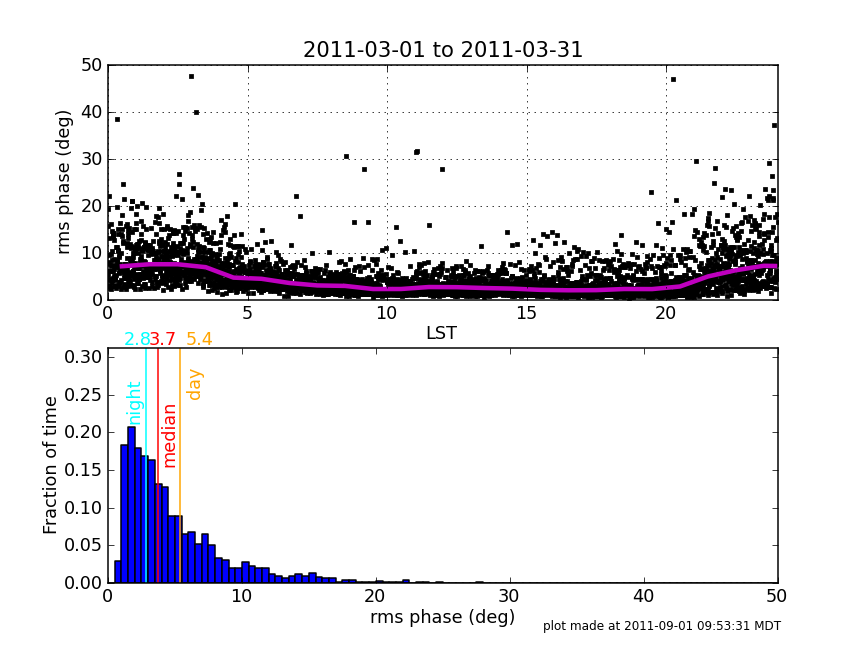
| 11:56, 1 September 2011 | Rmsphase March2011.png (file) |  |
60 KB | Thunter | 2 | |
| 18:44, 24 January 2013 | Baseband continuum changes.png (file) |  |
58 KB | Akepley | 1 | |
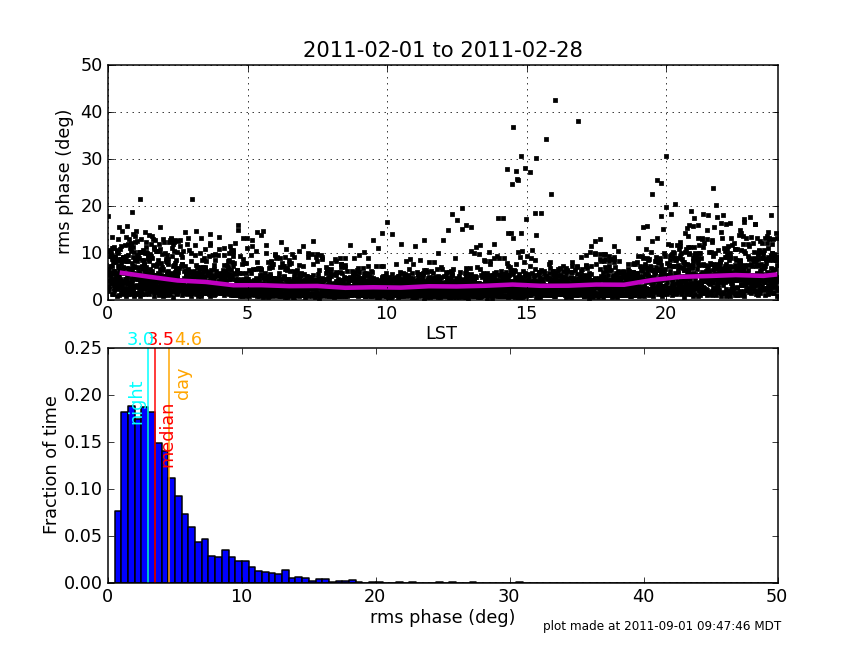
| 11:56, 1 September 2011 | Rmsphase February2011.png (file) |  |
58 KB | Thunter | 2 | |
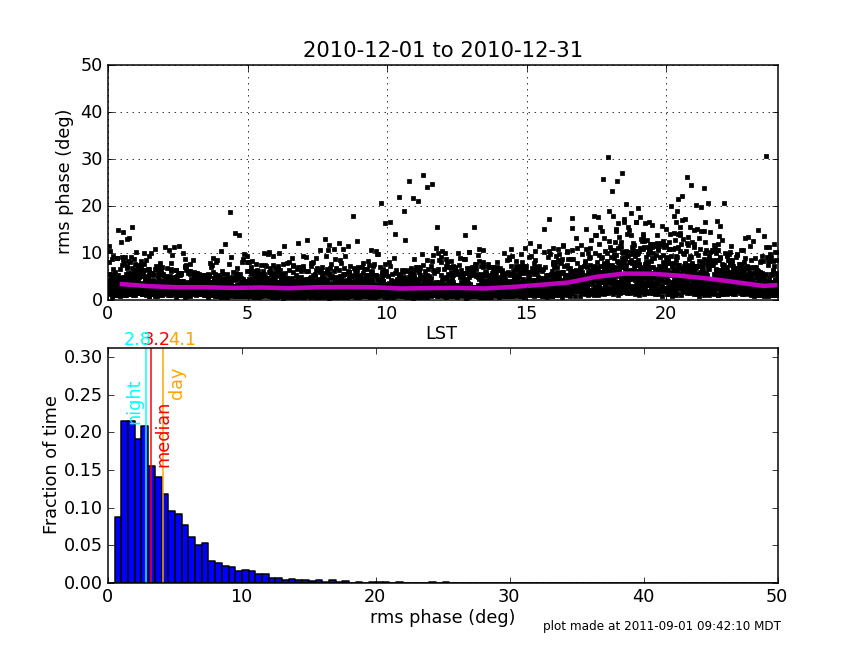
| 11:53, 1 September 2011 | Rmsphase December2010.png (file) |  |
58 KB | Thunter | 1 | |
| 11:53, 1 September 2011 | Rmsphase November2010.png (file) |  |
58 KB | Thunter | 1 | |
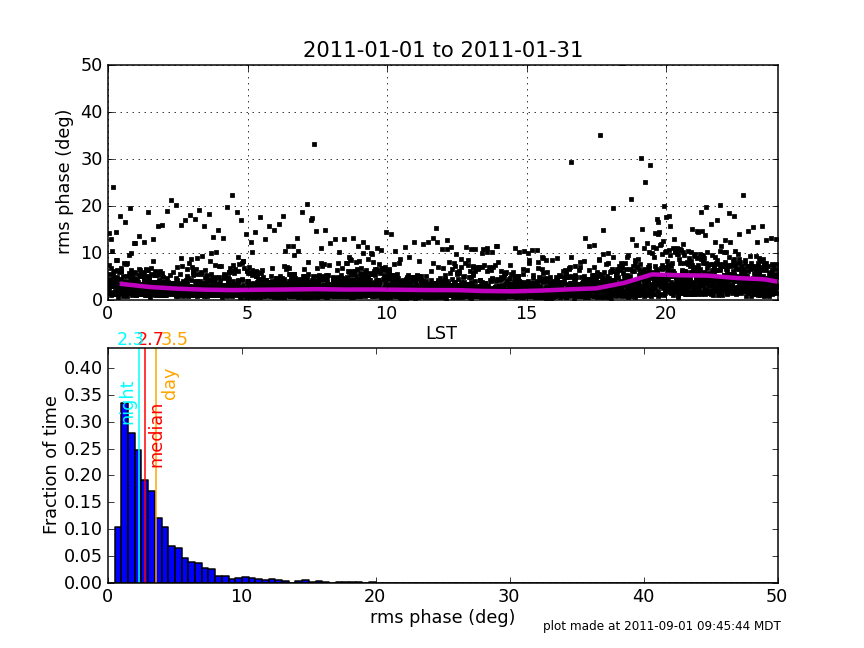
| 11:55, 1 September 2011 | Rmsphase January2011.png (file) |  |
57 KB | Thunter | 3 | |
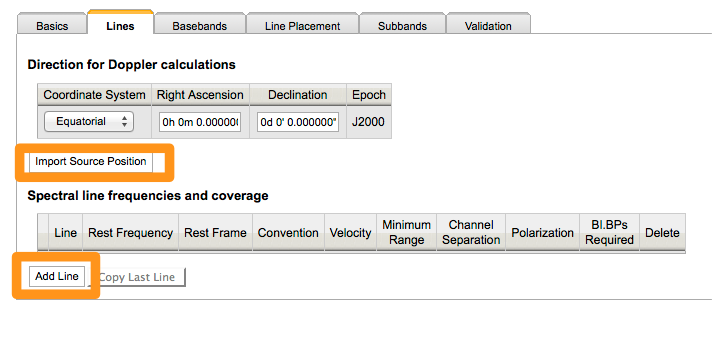
| 18:53, 24 January 2013 | Spectral line correlator line setup.png (file) |  |
57 KB | Akepley | 1 | |
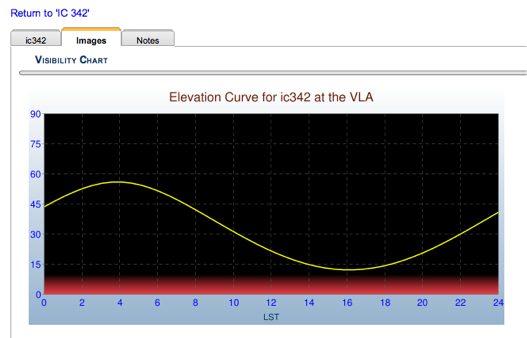
| 12:45, 13 April 2012 | Source elevation plot.png (file) |  |
53 KB | Akepley | 1 | |
| 17:14, 16 April 2012 | Skymap option.png (file) | 51 KB | Akepley | 2 | ||
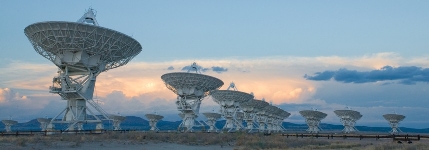
| 10:54, 8 April 2010 | Vla panorama lo.jpg (file) |  |
50 KB | Jmcmulli | 1 | |
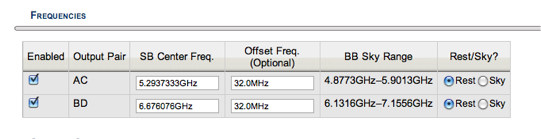
| 19:09, 11 April 2012 | Baseband frequency line dopset.png (file) | 48 KB | Akepley | 1 | ||
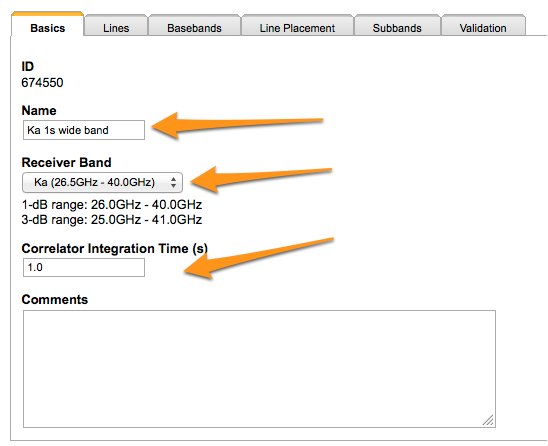
| 18:50, 24 January 2013 | Spectral line correlator basics.png (file) |  |
47 KB | Akepley | 1 | |
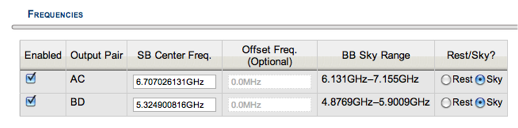
| 12:27, 13 April 2012 | Baseband frequency line.png (file) | 47 KB | Akepley | 1 | ||
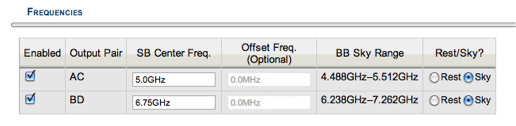
| 17:24, 16 April 2012 | Baseband frequency.png (file) | 46 KB | Akepley | 2 | ||
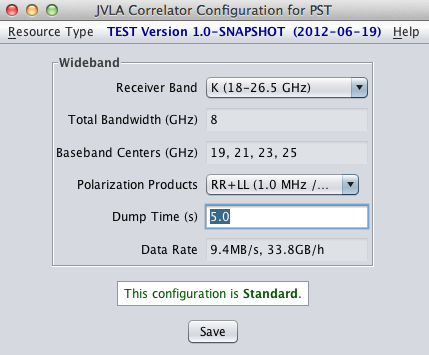
| 03:15, 20 June 2012 | PST-wide.png (file) |  |
43 KB | Jott | 1 | |
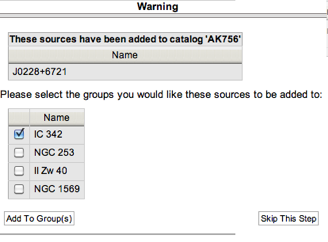
| 12:52, 13 April 2012 | Phase calibrator select group.png (file) |  |
41 KB | Akepley | 1 | |
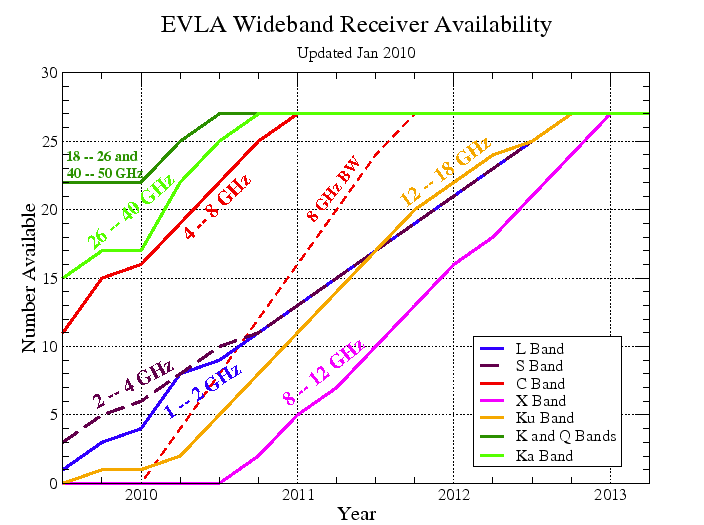
| 16:47, 13 April 2010 | EVLA WidebandRxAvailability.png (file) |  |
41 KB | Jmcmulli | Figure 1: EVLA Receiver Deployment Plan. Above is a plot of the availability of the final EVLA receivers from late 2009 until the end of the EVLA Construction Project in 2012. Only final EVLA receivers are shown. Interim receivers with reduced frequency c | 1 |
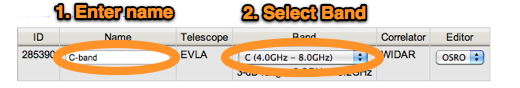
| 12:33, 13 April 2012 | Correlator name band.png (file) | 41 KB | Akepley | 1 | ||
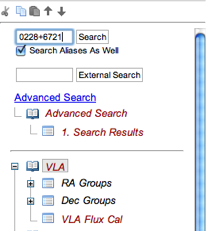
| 12:38, 13 April 2012 | Phase calibrator search.png (file) |  |
35 KB | Akepley | 1 | |
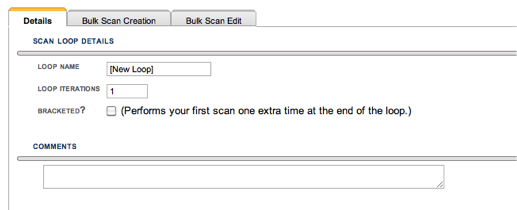
| 12:43, 13 April 2012 | Scan loop.png (file) |  |
30 KB | Akepley | 2 | |
| 18:12, 17 November 2011 | 3C286 Cband Darray.jpg (file) |  |
29 KB | Twiegert | 1 | |
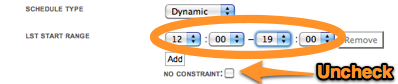
| 12:34, 13 April 2012 | Lst start range.png (file) | 27 KB | Akepley | 1 |