File:SEFD.png
From EVLA Guides
Jump to navigationJump to search
Size of this preview: 800 × 311 pixels. Other resolution: 1,255 × 488 pixels.
Original file (1,255 × 488 pixels, file size: 81 KB, MIME type: image/png)
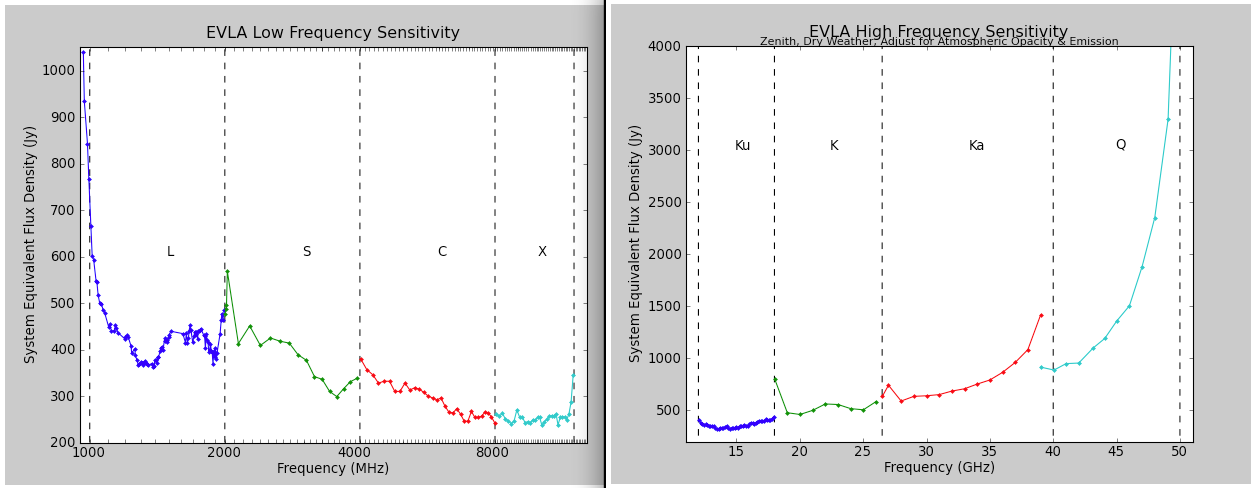
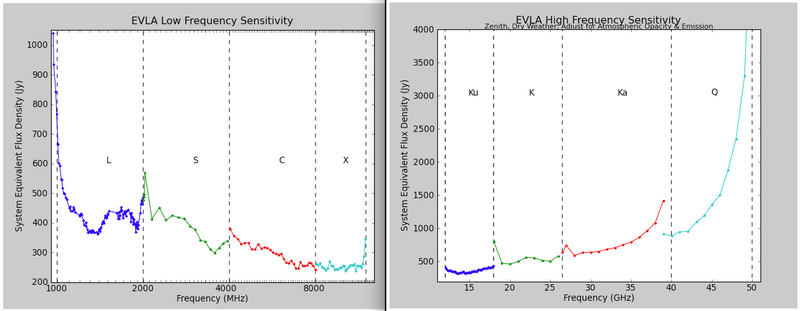
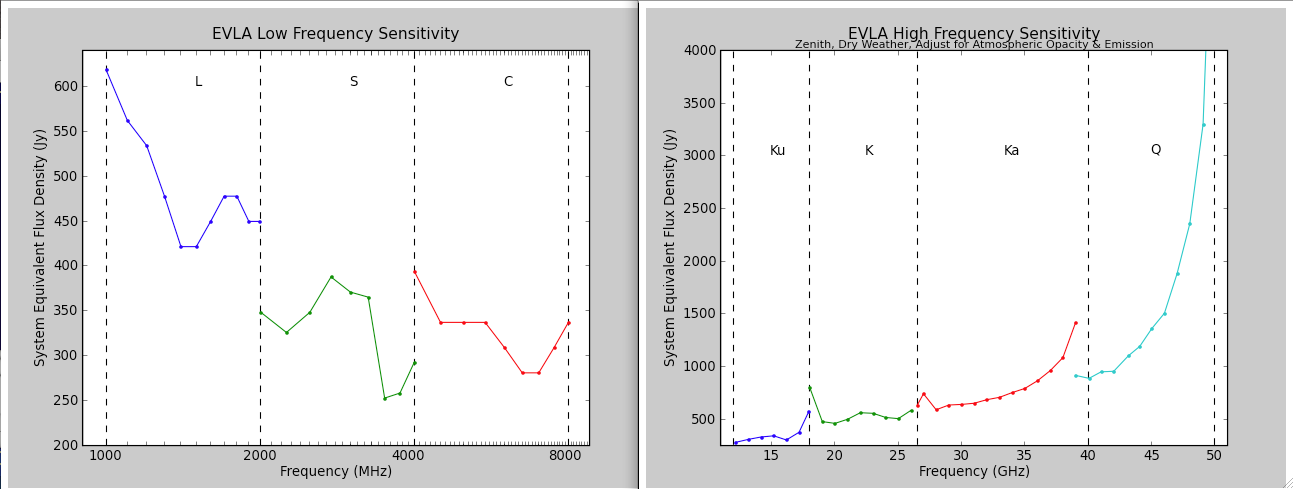
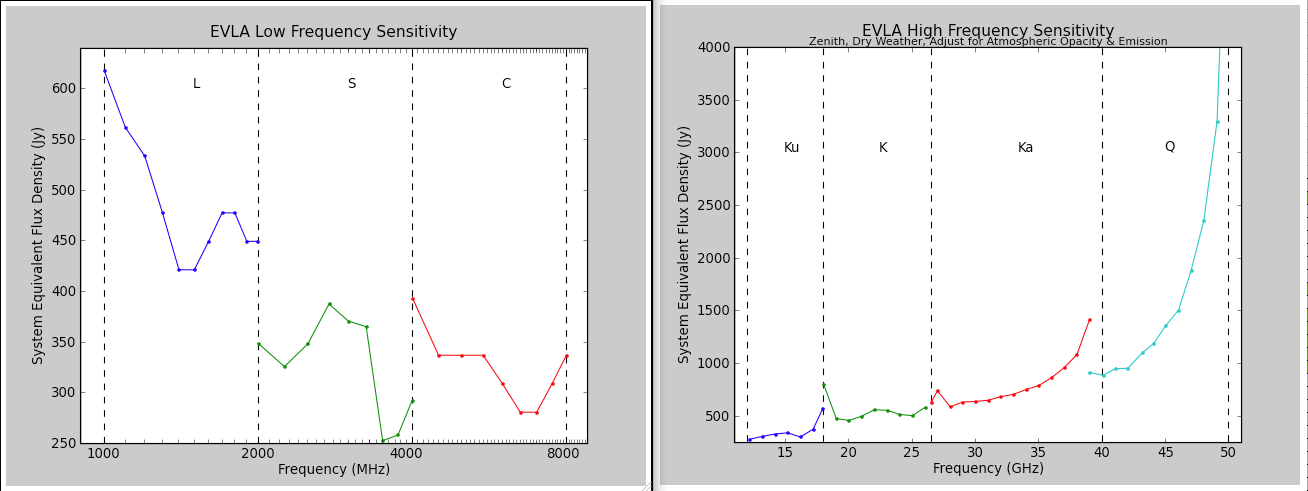
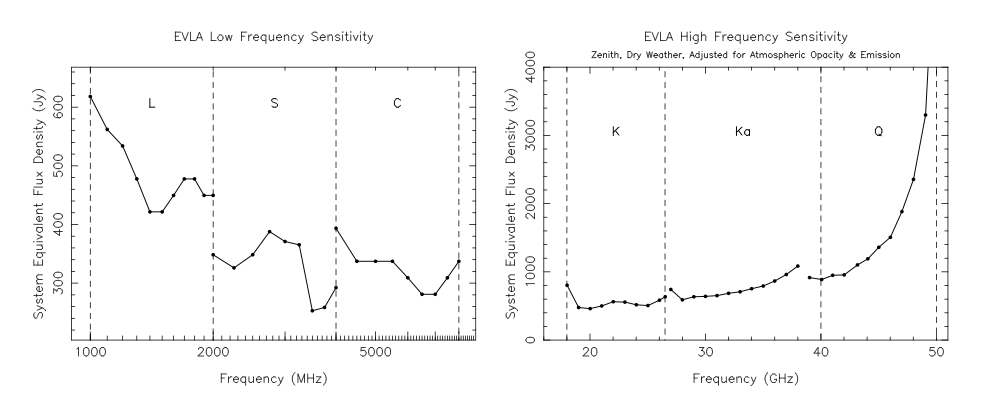
Figure 2: SEFD for the EVLA. Left: The system equivalent flux density as a function of frequency for the L, S, and C-band receivers; note the logarithmic frequency axis. Right: The system equivalent flux density as a function of frequency for the K, Ka, and Q-band receivers. The frequency axis is linear.
File history
Click on a date/time to view the file as it appeared at that time.
| Date/Time | Thumbnail | Dimensions | User | Comment | |
|---|---|---|---|---|---|
| current | 20:36, 29 June 2011 | 1,255 × 488 (81 KB) | Jmcmulli (talk | contribs) | ||
| 12:05, 14 December 2010 | 1,293 × 489 (70 KB) | Jmcmulli (talk | contribs) | Adjust limits of lower frequency plot. | ||
| 11:59, 14 December 2010 | 1,308 × 491 (72 KB) | Jmcmulli (talk | contribs) | Adds color; Ku band points. | ||
| 11:50, 14 April 2010 | 1,003 × 401 (59 KB) | Jmcmulli (talk | contribs) | Figure 2: SEFD for the EVLA. Left: The system equivalent flux density as a function of frequency for the L, S, and C-band receivers; note the logarithmic frequency axis. Right: The system equivalent flux density as a function of frequency for the K, Ka, a |
You cannot overwrite this file.
File usage
The following 2 pages use this file: