File:Lband sweep.png
From EVLA Guides
Revision as of 11:08, 14 April 2010 by Jmcmulli (talk | contribs) (Figure 3: Spectrum of L-band RFI. This shows the major interfering signals seen across the full 1 GHz bandwidth available to the L-band receivers. Each of the eight “spectral windows” displays 128 MHz from a separate sub-band. These are raw data, unca)
Size of this preview: 800 × 589 pixels. Other resolution: 966 × 711 pixels.
Original file (966 × 711 pixels, file size: 127 KB, MIME type: image/png)
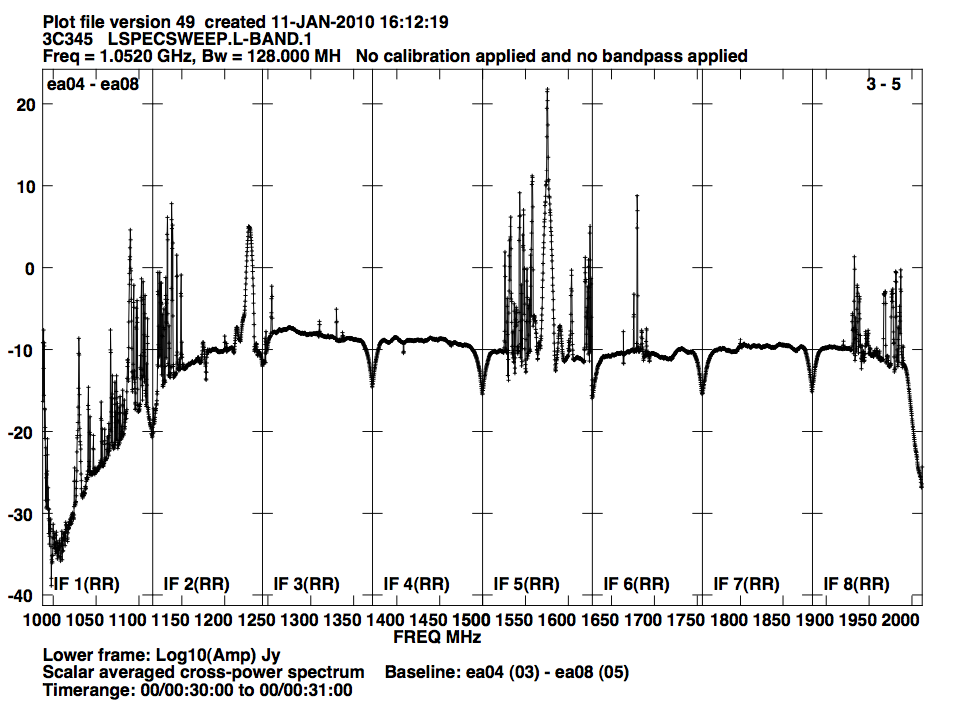
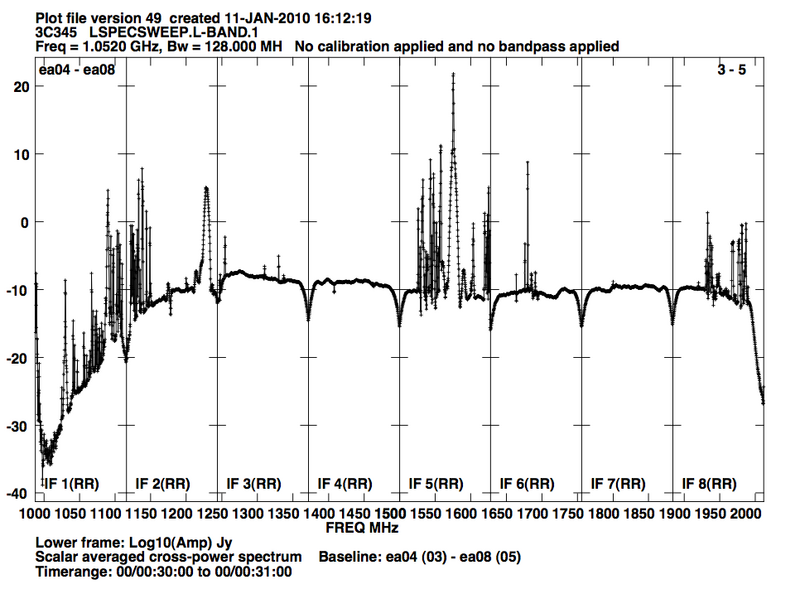
Figure 3: Spectrum of L-band RFI. This shows the major interfering signals seen across the full 1 GHz bandwidth available to the L-band receivers. Each of the eight “spectral windows” displays 128 MHz from a separate sub-band. These are raw data, uncalibrated for the bandpass of either the digital filter or the receiver. The high linearity of the EVLA’s electronics and correlator will permit astronomical observing within any frequencies not containing external interference.
File history
Click on a date/time to view the file as it appeared at that time.
| Date/Time | Thumbnail | Dimensions | User | Comment | |
|---|---|---|---|---|---|
| current | 11:08, 14 April 2010 | | 966 × 711 (127 KB) | Jmcmulli (talk | contribs) | Figure 3: Spectrum of L-band RFI. This shows the major interfering signals seen across the full 1 GHz bandwidth available to the L-band receivers. Each of the eight “spectral windows” displays 128 MHz from a separate sub-band. These are raw data, unca |
You cannot overwrite this file.
File usage
The following 2 pages use this file: