File:4-bandResponse.png: Difference between revisions
From EVLA Guides
Jump to navigationJump to search
(Plot of the frequency response of Cygnus A observed with WIDAR over a 16 MHz bandpass on one representative baseline. The response peaks at 74 MHz but has signal over 16 MHz; at the upper under the response is limited by a ~14 MHz filter centered at 70 MH) |
(No difference)
|
Latest revision as of 13:58, 22 September 2010
Plot of the frequency response of Cygnus A observed with WIDAR over a 16 MHz bandpass on one representative baseline. The response peaks at 74 MHz but has signal over 16 MHz; at the upper under the response is limited by a ~14 MHz filter centered at 70 MHz, while the lower end rolls off due to the dipole response.
File history
Click on a date/time to view the file as it appeared at that time.
| Date/Time | Thumbnail | Dimensions | User | Comment | |
|---|---|---|---|---|---|
| current | 13:58, 22 September 2010 | 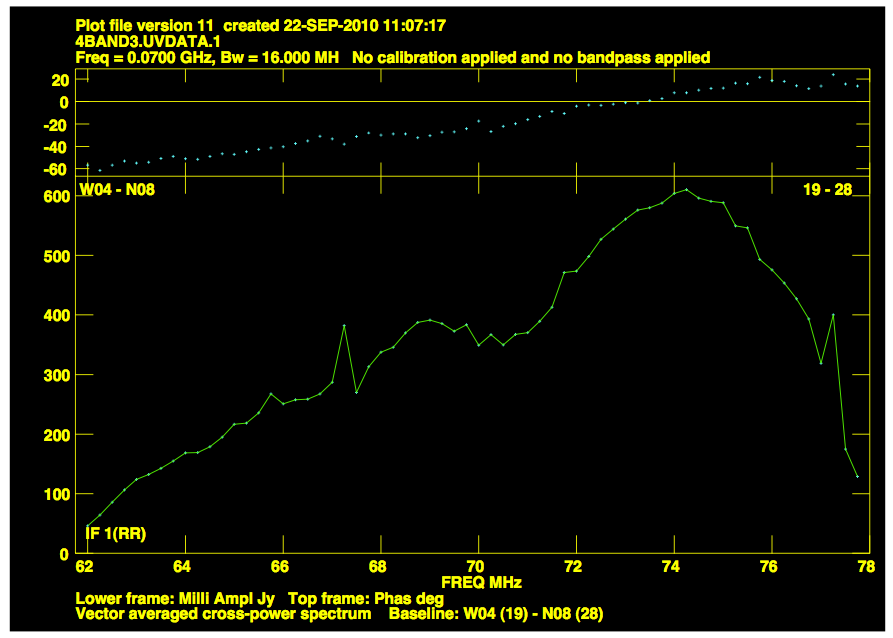 | 893 × 638 (68 KB) | Jmcmulli (talk | contribs) | Plot of the frequency response of Cygnus A observed with WIDAR over a 16 MHz bandpass on one representative baseline. The response peaks at 74 MHz but has signal over 16 MHz; at the upper under the response is limited by a ~14 MHz filter centered at 70 MH |
You cannot overwrite this file.
File usage
There are no pages that use this file.