Monthly Conditions at EVLA
From EVLA Guides
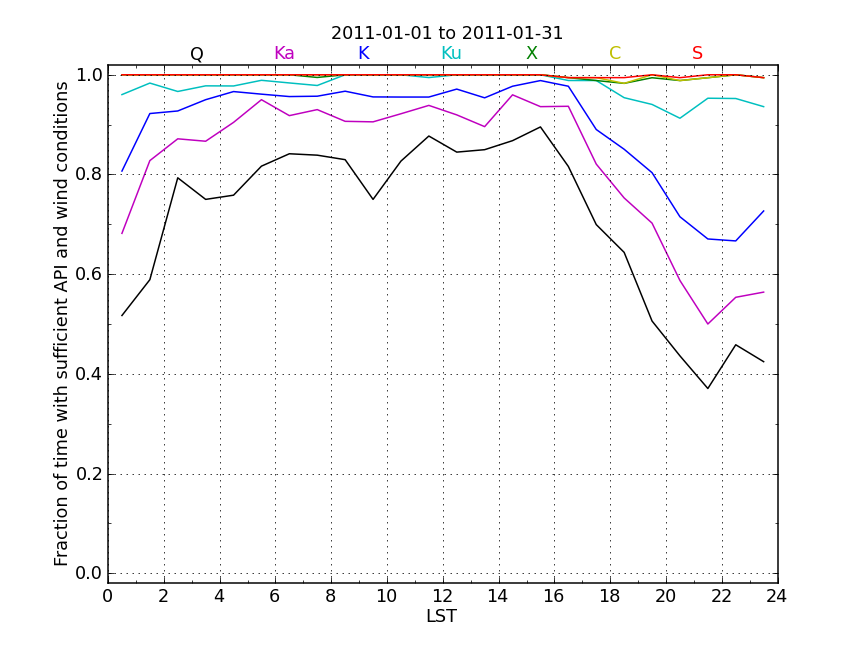
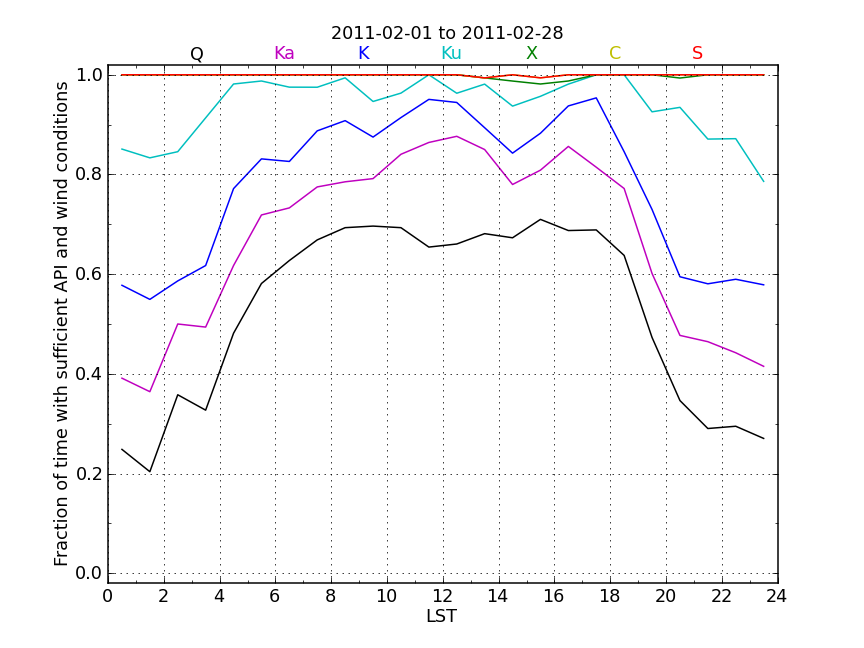
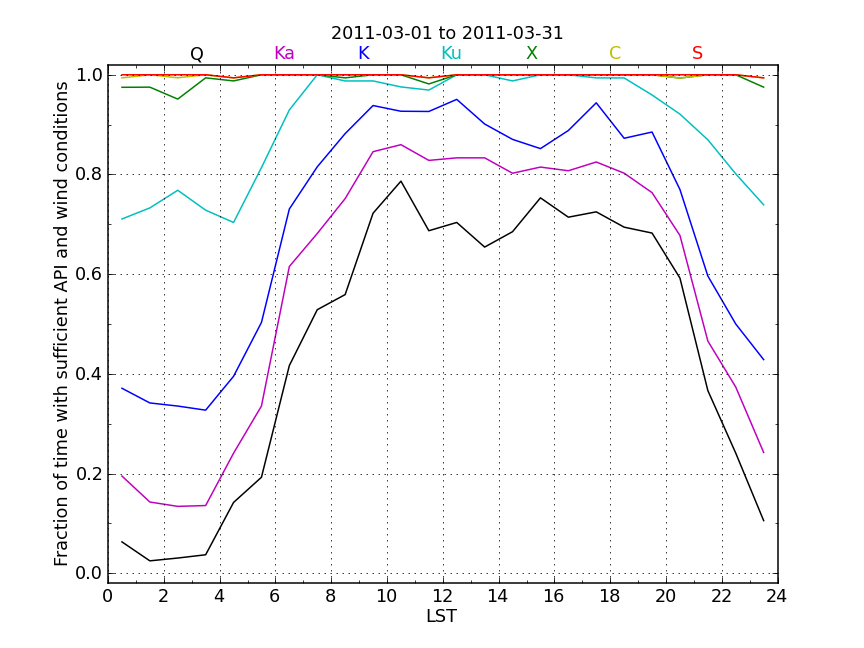
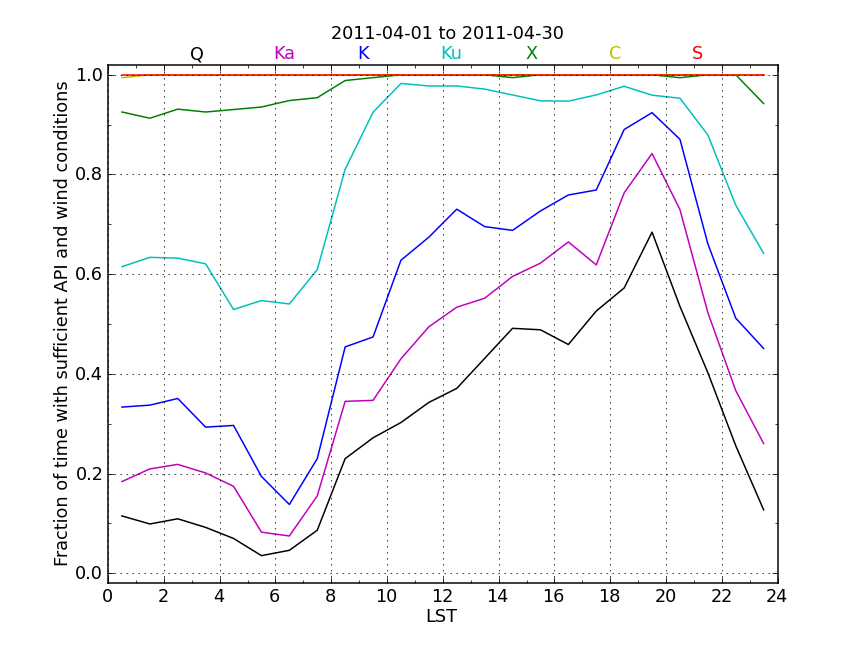
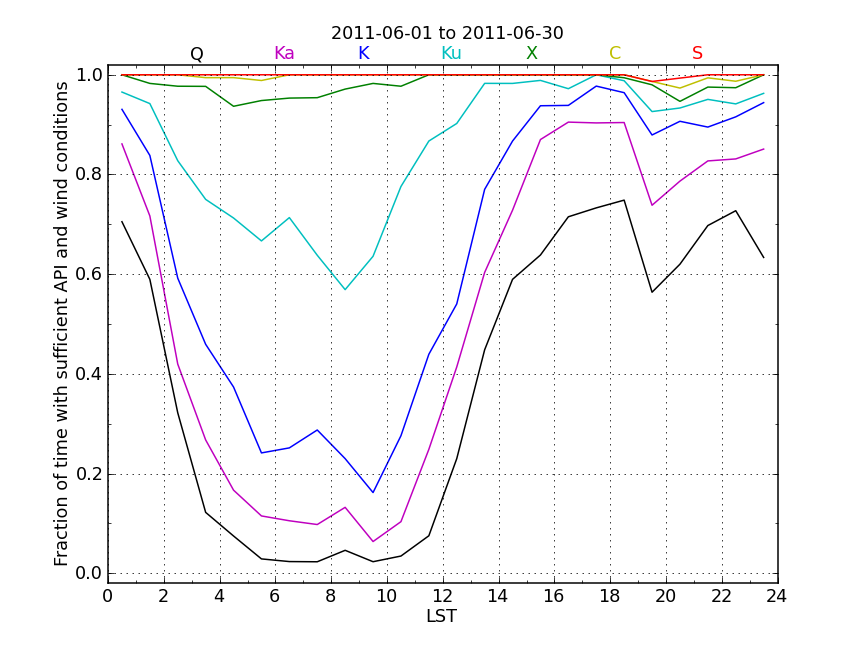
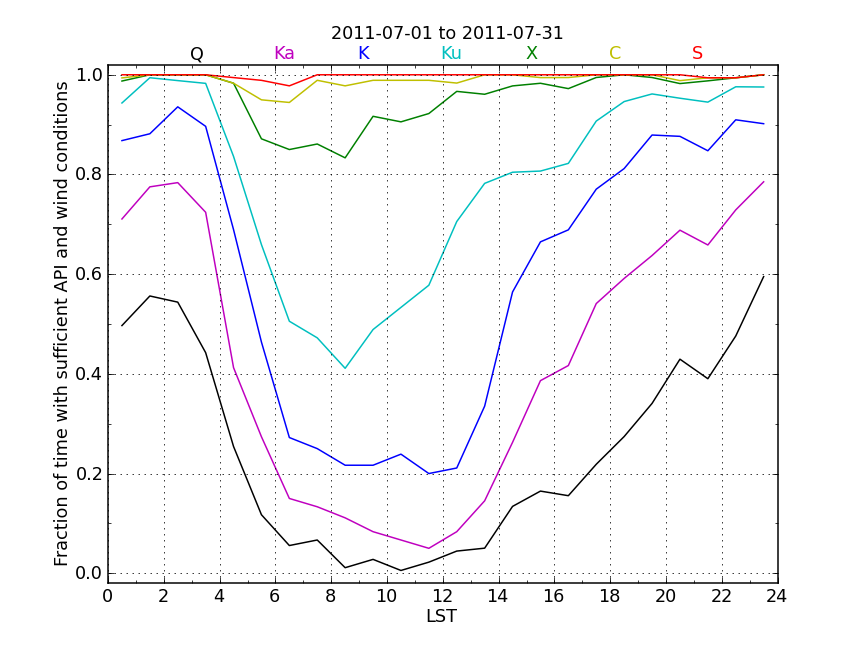
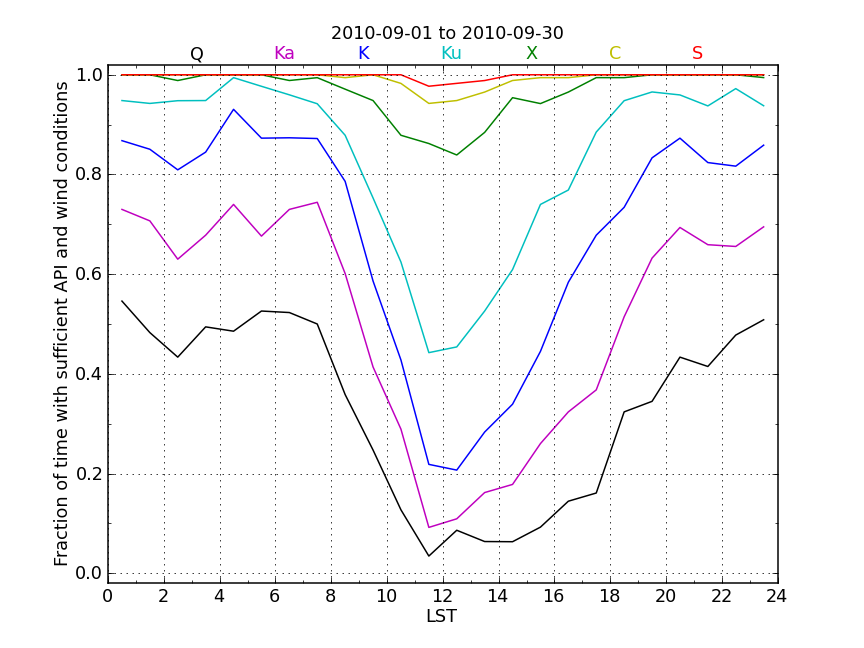
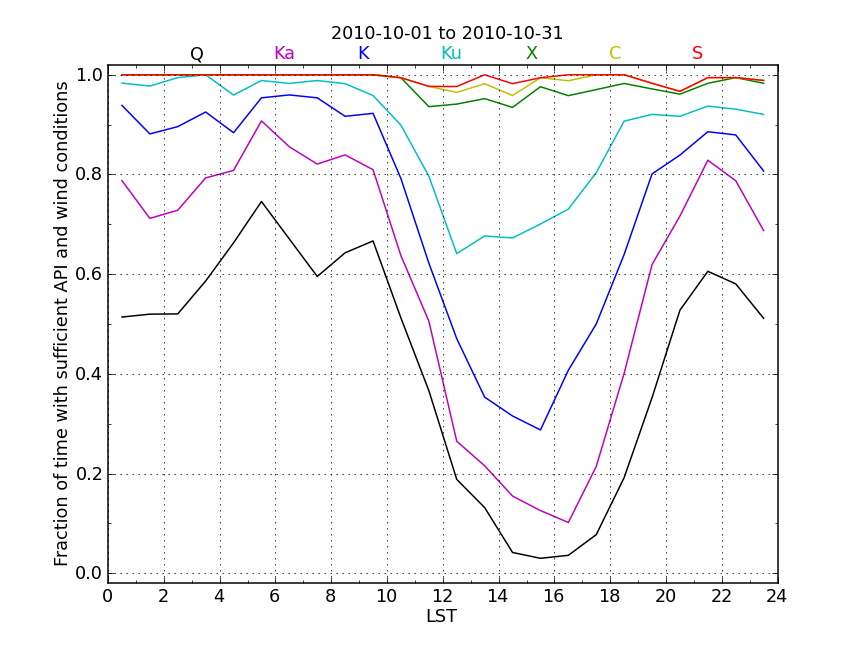
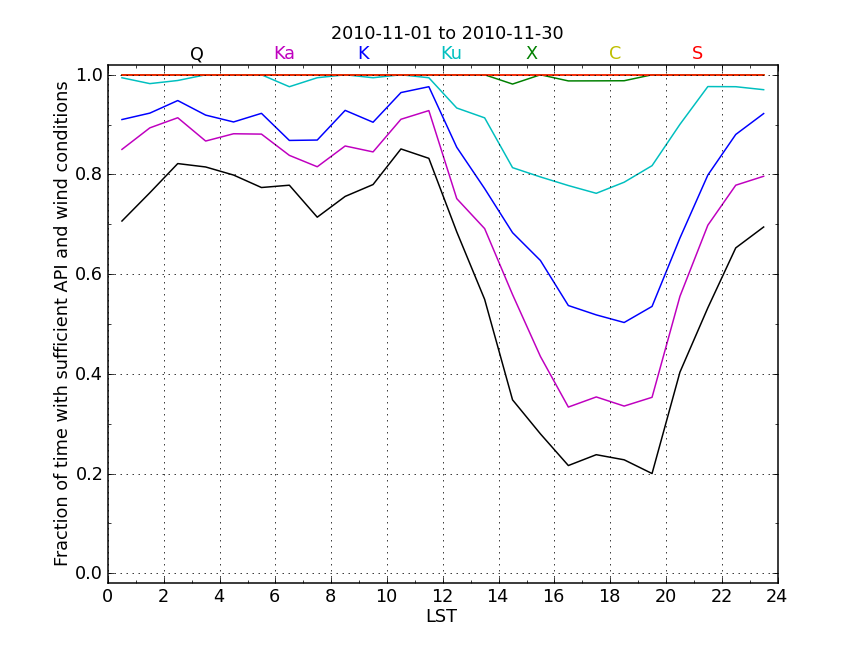
The following plots show the fraction of time that was most suitable for observing in each EVLA band for the one-year period September 2010 - August 2011, according to the measured wind speed and API phase rms (opacity is not included). Click any plot to enlarge it. The simultaneous requirements for wind speed and API phase rms used to create these plots correspond to the current table of values in the OPT:
| Band: | 4, P, L | S | C | X | Ku | K | Ka | Q |
|---|---|---|---|---|---|---|---|---|
| API (deg) | any | <60 | <45 | <30 | <15 | <10 | <7 | <5 |
| wind (m/s) | any | any | any | <15 | <10 | <7 | <6 | <5 |
See also the monthly plots of API rms phase vs LST Return to the High Frequency observing guide
| January | February | March |
|---|---|---|
 |
 |
 |
| April | May | June |
 |
 |
 |
| July | August | September |
 |
 |
 |
| October | November | December |
 |
 |
 |