Archival API Plots: Difference between revisions
From EVLA Guides
Jump to navigationJump to search
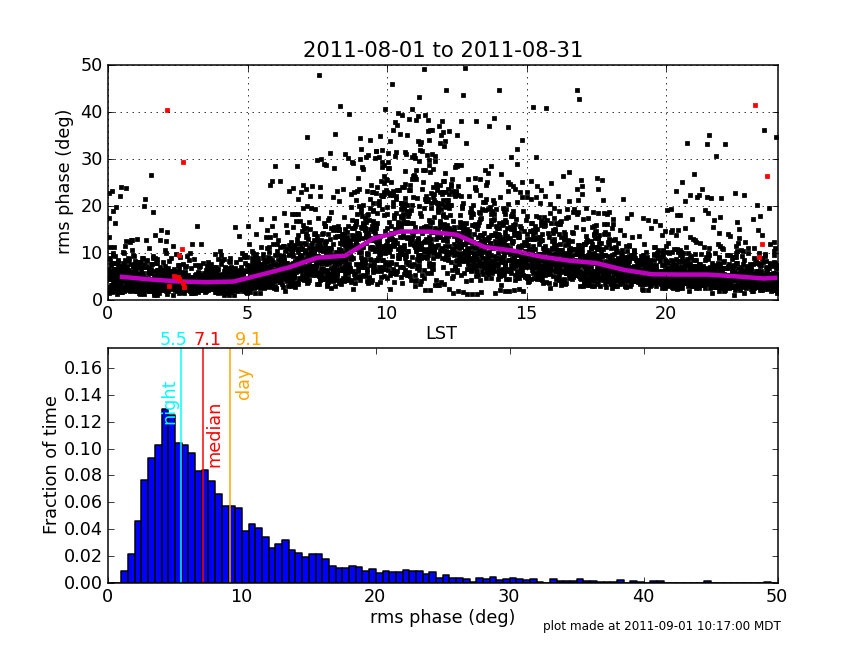
Created page with "August 2011 center|600px''API rms phase for August 2011''" |
No edit summary |
||
| Line 1: | Line 1: | ||
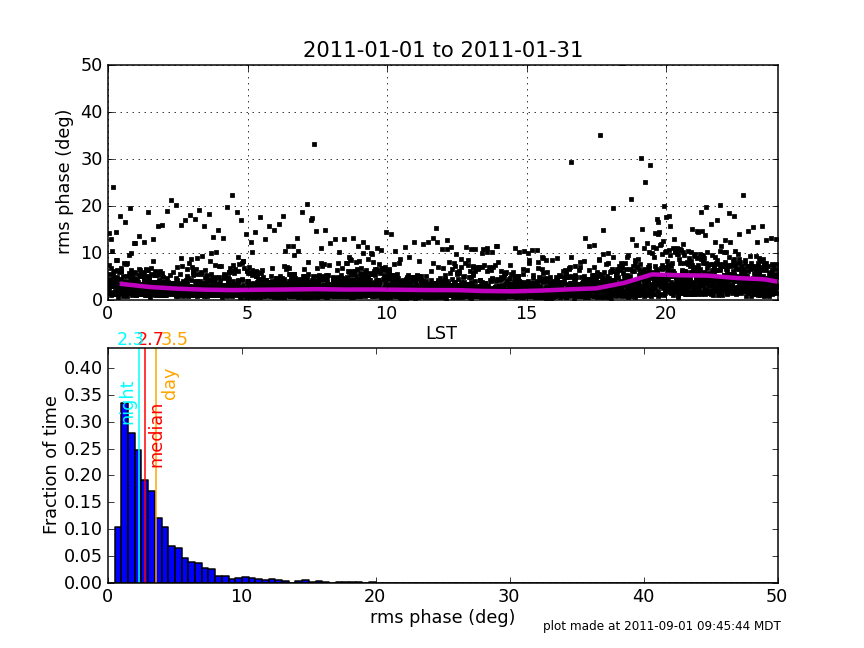
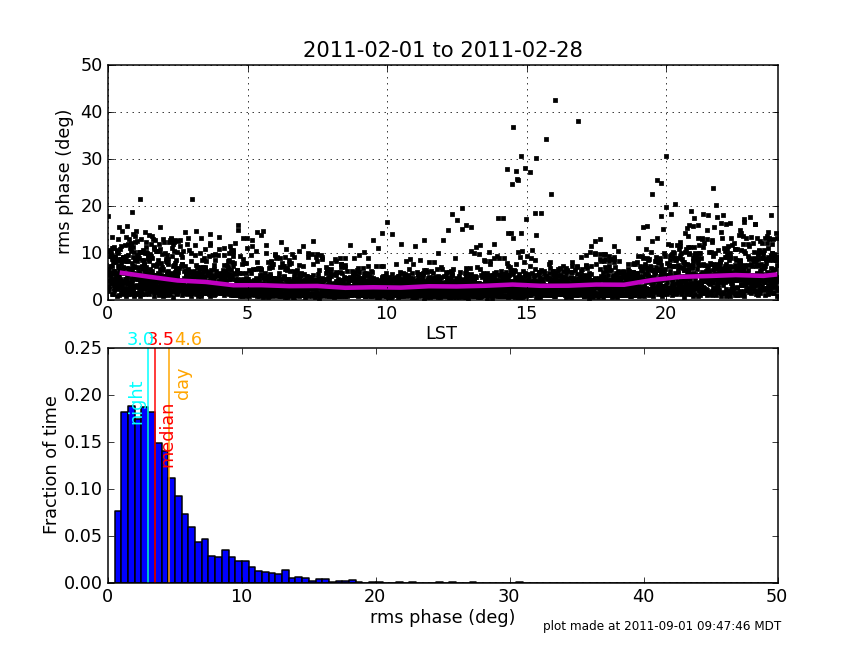
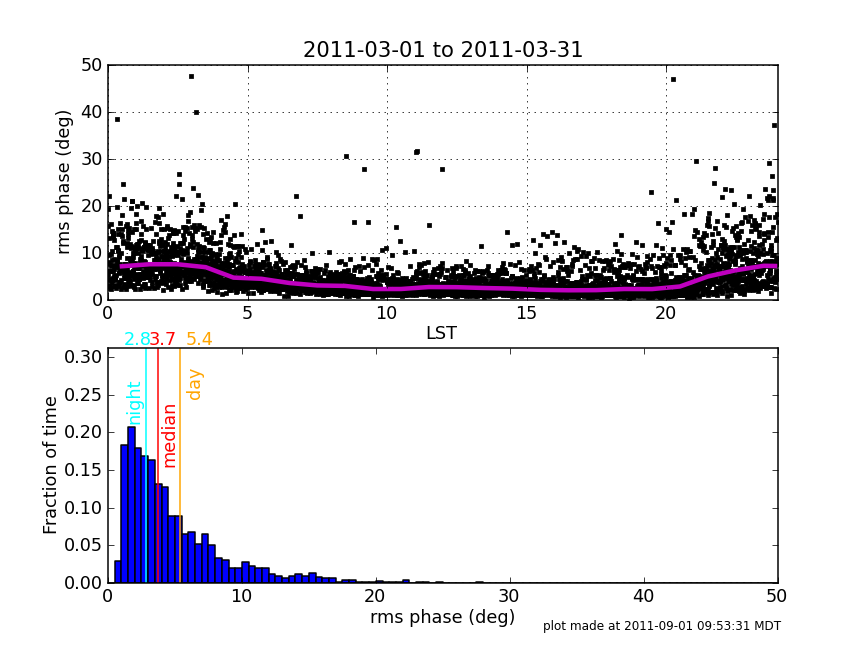
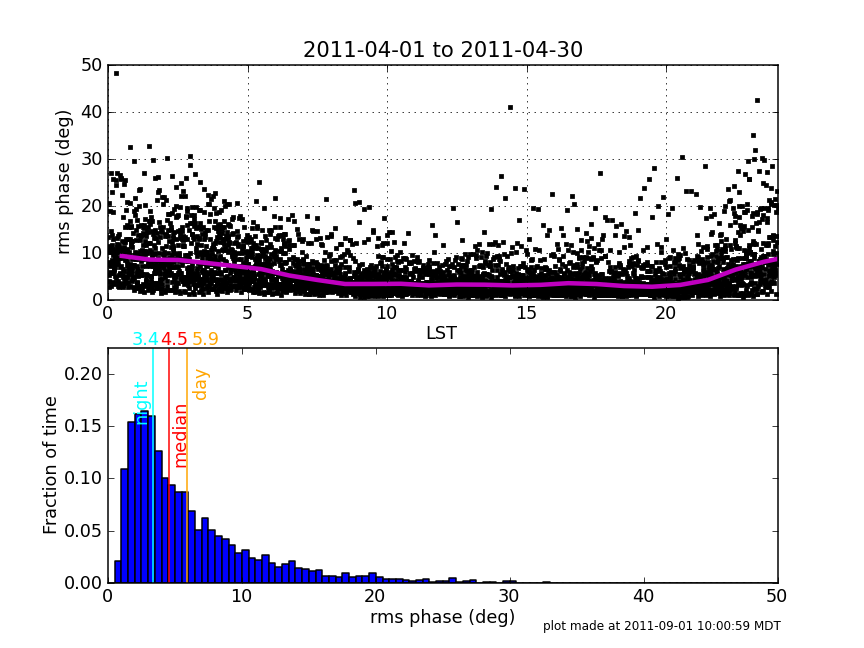
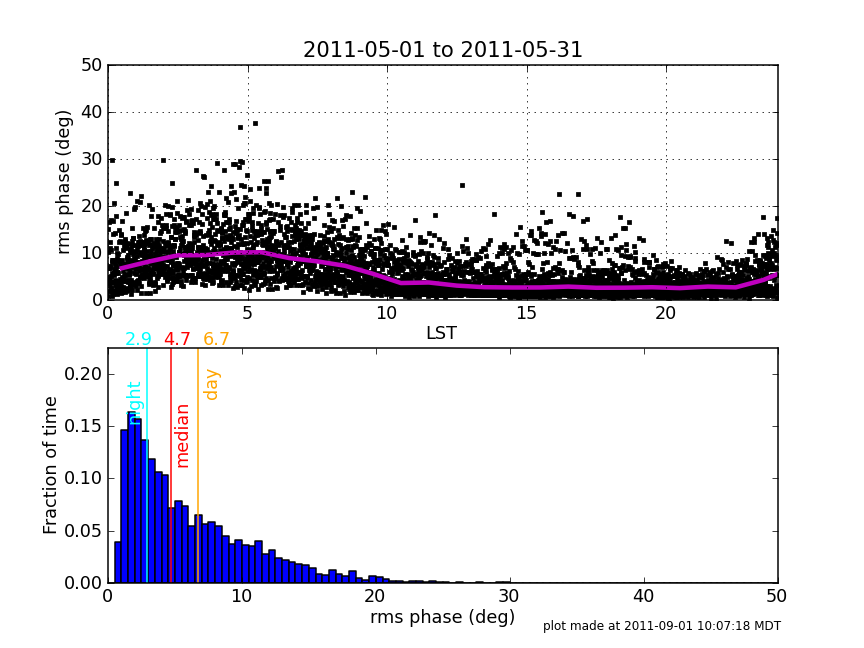
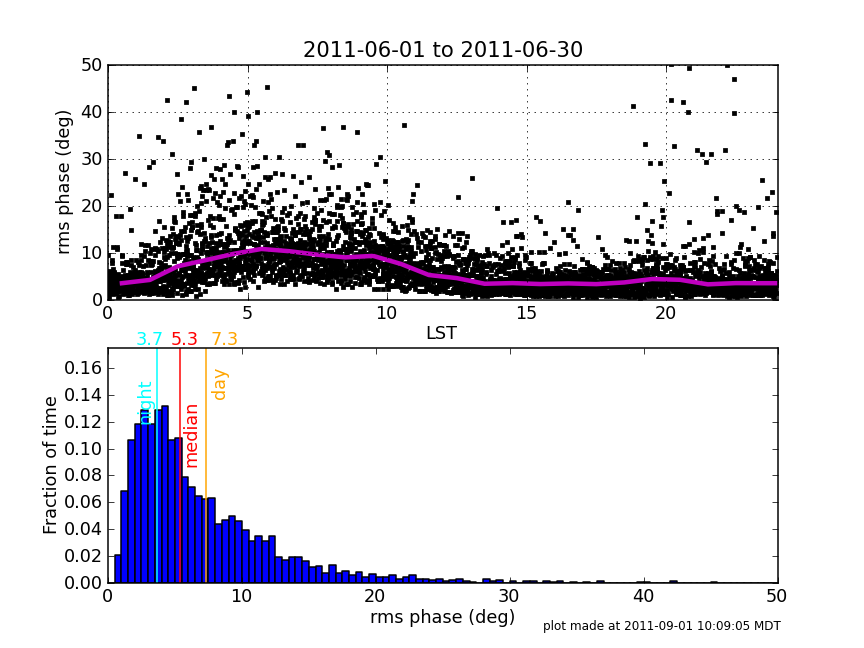
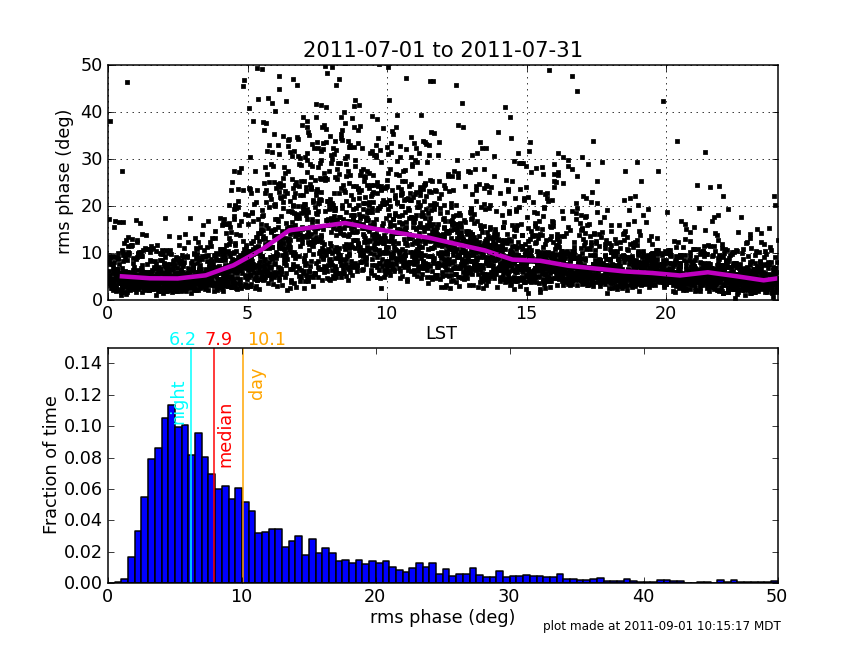
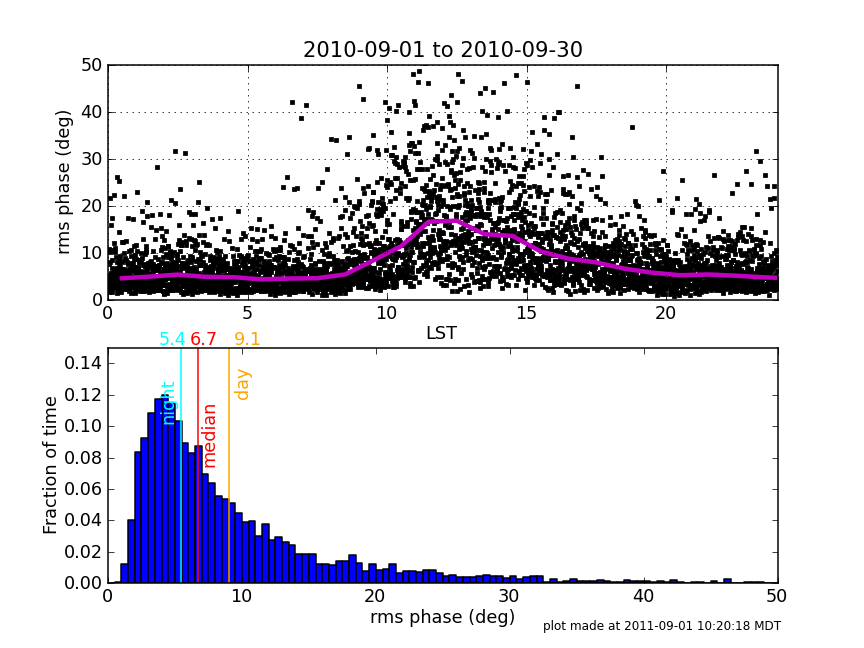
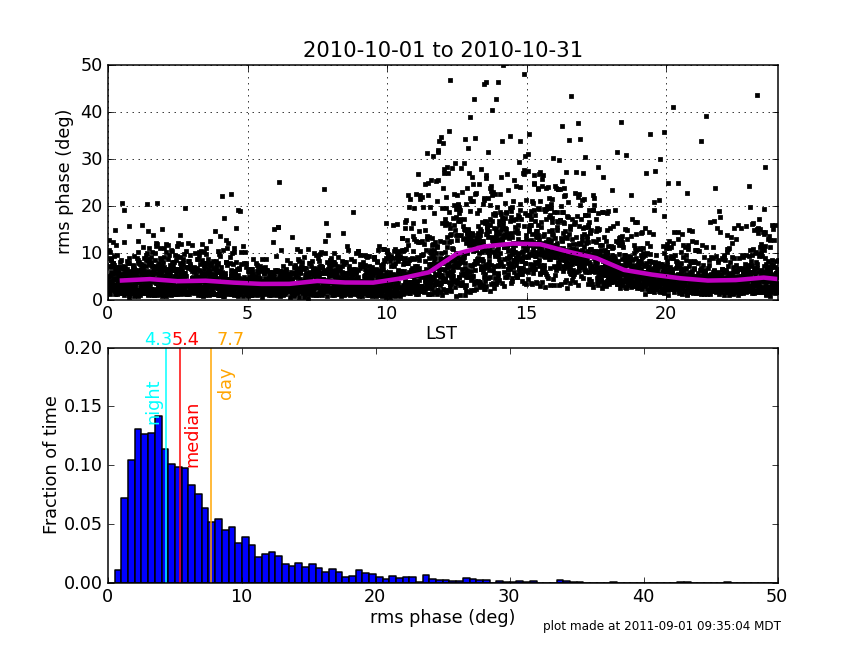
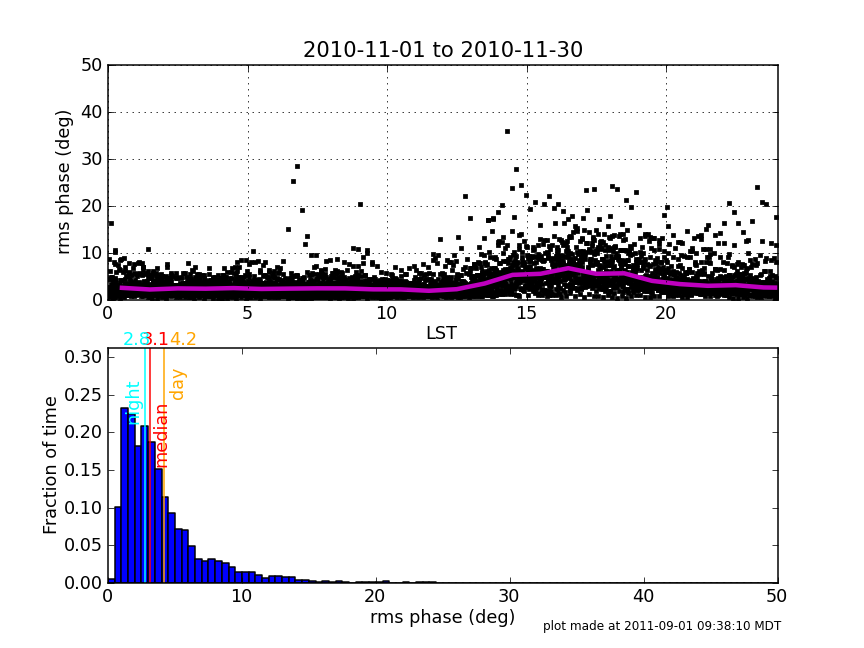
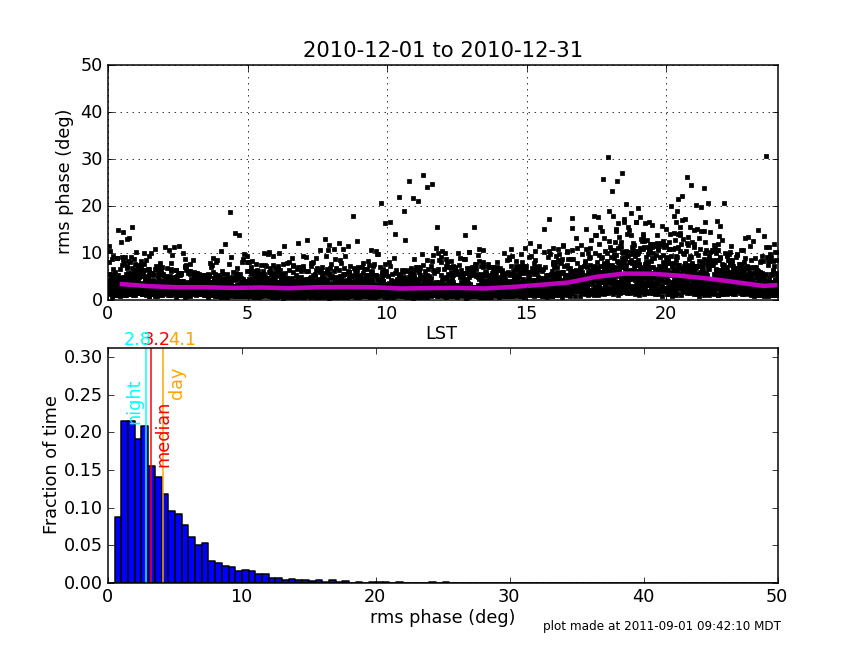
The magenta line is the median computed per LST hour. | |||
[[Image:rmsphase_August2011.png|center|600px]]'' | |||
[[Image:rmsphase_January2011.png|center|600px]]''January'' | |||
[[Image:rmsphase_February2011.png|center|600px]]'' '' | |||
[[Image:rmsphase_March2011.png|center|600px]]'' '' | |||
[[Image:rmsphase_April2011.png|center|600px]]'' '' | |||
[[Image:rmsphase_May2011.png|center|600px]]'' '' | |||
[[Image:rmsphase_June2011.png|center|600px]]'' '' | |||
[[Image:rmsphase_July2011.png|center|600px]]'' '' | |||
[[Image:rmsphase_August2011.png|center|600px]]'' '' | |||
[[Image:rmsphase_September2010.png|center|600px]]'' '' | |||
[[Image:rmsphase_October2010.png|center|600px]]'' '' | |||
[[Image:rmsphase_November2010.png|center|600px]]'' '' | |||
[[Image:rmsphase_December2010.png|center|600px]]'''' | |||
