Category:OPT-QuickStart: Difference between revisions
No edit summary |
|||
| (24 intermediate revisions by 2 users not shown) | |||
| Line 1: | Line 1: | ||
==Introduction== | ==Introduction== | ||
'''Note (1/ | '''Note (1/25/2012): This guide has been updated for the lastest version of the OPT. Please contact Amanda Kepley (akepley@nrao.edu) for comments/questions suggestions about this guide and the NRAO helpdesk for any questions about the OPT.''' | ||
<span style="font-size:140%; color:red"> | |||
'''Note (9/30/2014): This guide no longer reflects the current state of the OPT due to limited support. Please consult the official OPT manual.''' | |||
</span> | |||
The goal of this guide is to provide a brief, practical introduction to using the Observing Preparation Tool (OPT) to create scheduling blocks for the VLA. After reading this guide, you should be able to successfully create a simple VLA scheduling block. Please send any questions, comments, or suggestions about this documentation to Amanda Kepley (akepley@nrao.edu). For questions about the OPT, please contact the NRAO Help Desk via the my.nrao.edu portal. | The goal of this guide is to provide a brief, practical introduction to using the Observing Preparation Tool (OPT) to create scheduling blocks for the VLA. After reading this guide, you should be able to successfully create a simple VLA scheduling block. Please send any questions, comments, or suggestions about this documentation to Amanda Kepley (akepley@nrao.edu). For questions about the OPT, please contact the NRAO Help Desk via the my.nrao.edu portal. | ||
| Line 132: | Line 138: | ||
===Configuring for "Continuum" Observations=== | ===Configuring for "Continuum" Observations=== | ||
If you observing continuum, there are default continuum configurations available for you to use in the "NRAO Defaults" group. These setups will also work for spectral line work provided that they adequately resolve your line and you don't want to use Doppler setting (see next section). The default continuum configuration group includes both 3-bit and 8-bit configurations. The catalog name is currently "D/Any config 13A". Use the catalog comments to determine which one you want to use. You can use the copy and paste procedure to add one of these configurations to your personal catalog. | If you observing continuum, there are default continuum configurations available for you to use in the "NRAO Defaults" group. These setups will also work for spectral line work provided that they adequately resolve your line and you don't want to use Doppler setting (see next section). The default continuum configuration group includes both 3-bit and 8-bit configurations. The catalog name is currently "D/Any config 13A". Use the catalog comments to determine which one you want to use. You can use the copy and paste procedure to add one of these configurations to your personal catalog. ''Currently copying a individual configuration out of a resource group doesn't work. However, you can still copy the setting if you select the entire catalog and then the individual resource.'' Once you copy and paste the configuration into your personal catalog, you can change the configuration name, the default baseband frequencies and polarization. | ||
You can change the name of your catalog in the basics tab. Changing it to a unique descriptive name will help with creating and checking scheduling blocks. Please use the default integration time for your observing frequency and configuration. Do not use integration times shorter than the default unless it is necessary for your science. Shorter integration times lead to higher data rates, which is given in the "Correlator Setup" section under the integration time. | |||
[[Image:initial_continuum_changes.png]] | |||
To change your baseband frequency, change the frequency for the center of the baseband in the basebands tab. Do not select Doppler Setting! The plot above should change to show your current baseband tuning. The 3 dB edges of the band are indicated by dotted lines. The green lines show the full sensitivity range of the basebands. If you hover your mouse over a particular baseband, the center frequency of that baseband will be displayed. | |||
[[Image:baseband_continuum_changes.png]] | |||
To change | To change the polarization of the sub-bands, go the subbands tab. From there, select all the sub-bands, choose bulk-edit sub-bands, select the desired polarization, and click okay. You need to repeat this for each baseband. | ||
[[Image:polarization_continuum_changes.png]] | |||
If you're doing spectral line work using the standard "continuum" setups, enter the sky frequency plus an offset equal to half the sub-band width into the "SB Center Freq" boxes. IT IS VERY IMPORTANT THAT YOU DO NOT ENTER THE SKY FREQUENCY INTO THE "SB Center Freq" BOX. IF YOU DO THIS, YOU WILL PLACE YOUR LINE AT THE BOUNDARY OF TWO 128MHz FILTERS WHERE THE SENSITIVITY IS SIGNIFICANTLY DECREASED AND CALIBRATION BECOMES MUCH MORE DIFFICULT. Adding an offset of 1/2 the width of an individual sub-band places your line in the center of a sub-band. You can calculate the sky frequency manually using the [http://www.vla.nrao.edu/astro/guides/dopset/ dopset] tool. | If you're doing spectral line work using the standard "continuum" setups, enter the sky frequency plus an offset equal to half the sub-band width into the "SB Center Freq" boxes. IT IS VERY IMPORTANT THAT YOU DO NOT ENTER THE SKY FREQUENCY INTO THE "SB Center Freq" BOX. IF YOU DO THIS, YOU WILL PLACE YOUR LINE AT THE BOUNDARY OF TWO 128MHz FILTERS WHERE THE SENSITIVITY IS SIGNIFICANTLY DECREASED AND CALIBRATION BECOMES MUCH MORE DIFFICULT. Adding an offset of 1/2 the width of an individual sub-band places your line in the center of a sub-band. You can calculate the sky frequency manually using the [http://www.vla.nrao.edu/astro/guides/dopset/ dopset] tool. | ||
Finally, if you're made any changes validate your correlator setup in the validation tab. This tab gives an overview of the correlator resources you're using and the setup of the correlator. | |||
[[Image:validation_continuum_changes.png]] | |||
===Configuring for Spectral Line Observations=== | ===Configuring for Spectral Line Observations=== | ||
| Line 161: | Line 173: | ||
* Create a new spectral line resource catalog by selecting File->Create New->Catalog. | * Create a new spectral line resource catalog by selecting File->Create New->Catalog. | ||
* Create a new spectral line resource by selecting File->Create New->8-bit Instrument configuration. General spectral line observations that need more than the standard 3-bit continuum configuration are currently required to use 8-bit mode. A new instrument configuration window should pop up. The window has three parts: 1) a plot showing the current correlator configuration, 2) a table showing the correlator resources used, and 3) a series of tabs for configuring the correlator. In the plot, the 3 dB edges of the band are indicated by dotted lines. The green lines show the full sensitivity range of the band. If you hover your mouse over a particular baseband, the center frequency of that baseband will be displayed [[Image:spectral_line_correlator_window_overview.png]] | * Create a new spectral line resource by selecting File->Create New->8-bit Instrument configuration. General spectral line observations that need more than the standard 3-bit continuum configuration are currently required to use 8-bit mode. A new instrument configuration window should pop up. The window has three parts: 1) a plot showing the current correlator configuration, 2) a table showing the correlator resources used, and 3) a series of tabs for configuring the correlator. In the plot, the 3 dB edges of the band are indicated by dotted lines. The green lines show the full sensitivity range of the band. If you hover your mouse over a particular baseband, the center frequency of that baseband will be displayed [[Image:spectral_line_correlator_window_overview.png]] | ||
* The first tab you should see is the basics tab. Here you can name your configuration, select the receiver, and desired integration time. Please use the default integration time for your observing frequency and configuration. Do not use integration times shorter than the default unless it is necessary for your science. Shorter integration times lead to higher data rates, which is given in the "Correlator Setup" section under the integration time. [[Image:spectral_line_correlator_basics.png]] | * The first tab you should see is the basics tab. Here you can name your configuration, select the receiver, and desired integration time. Please use the default integration time for your observing frequency and configuration. Do not use integration times shorter than the default unless it is necessary for your science. Shorter integration times lead to higher data rates, which is given in the "Correlator Setup" section under the integration time. <p>[[Image:spectral_line_correlator_basics.png]]</p> | ||
* Next go to the lines tab. In this tab, enter the information on the source and spectral lines you would line to observe. You can import source information from the catalog you created earlier to avoid having to retype things and introduce new errors. When you have multiple lines, copying the previous spectral line prevents you from having to re-enter defaults like the velocity definition and source velocity. The spectral line information is used generate sub-bands of the appropriate bandwidth and channel resolution to observe that line. You can change | * Next go to the lines tab. In this tab, enter the information on the source and spectral lines you would line to observe. You can import source information from the catalog you created earlier to avoid having to retype things and introduce new errors. When you have multiple lines, copying the previous spectral line prevents you from having to re-enter defaults like the velocity definition and source velocity. The spectral line information is used generate sub-bands of the appropriate bandwidth and channel resolution to observe that line. You can change the bandwidth and channel resolution for the individual line sub-bands later on in the sub-band configuration tab. The lines that you've added will show up in the overview plot above the tabs.<p> [[Image:spectral_line_correlator_line_setup.png]]</p> | ||
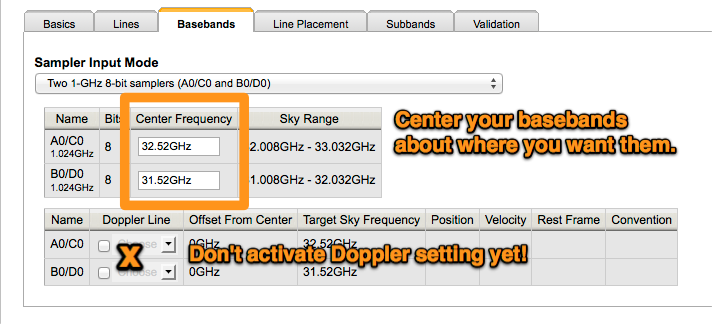
* Now on to the basebands tab! In this tab, center the basebands approximately where you want them, but '''do not select Doppler Setting yet.''' It's easier to set up the sub-bands before Doppler Setting has been activated. The base bands should roughly overlap your lines. [[Image:spectral_line_correlator_baseband_setup.png]] | * Now on to the basebands tab! In this tab, center the basebands approximately where you want them, but '''do not select Doppler Setting yet.''' It's easier to set up the sub-bands before Doppler Setting has been activated. The base bands should roughly overlap your lines. <p>[[Image:spectral_line_correlator_baseband_setup.png]]</p> | ||
* It's time for the fun part -- generating your spectral windows. To do this, go to the line placement tab, select the desired line, and click generate. The pop-up dialog box will ask you which baseband you want to add it to. If your line is already in a particular baseband, it should select that baseband automatically. Select the appropriate baseband (if not already selected) and click Okay. If you click generate multiple times you will get multiple windows. You can just delete the extra windows in the sub-band configuration window. As they are generated, the sub-bands will show up in the overview plot. [[Image:spectral_line_correlator_generate_spws.png]] | * It's time for the fun part -- generating your spectral windows. To do this, go to the line placement tab, select the desired line, and click generate. The pop-up dialog box will ask you which baseband you want to add it to. If your line is already in a particular baseband, it should select that baseband automatically. Select the appropriate baseband (if not already selected) and click Okay. If you click generate multiple times you will get multiple windows. You can just delete the extra windows in the sub-band configuration window. As they are generated, the sub-bands will show up in the overview plot. <p>[[Image:spectral_line_correlator_generate_spws.png]]</p> | ||
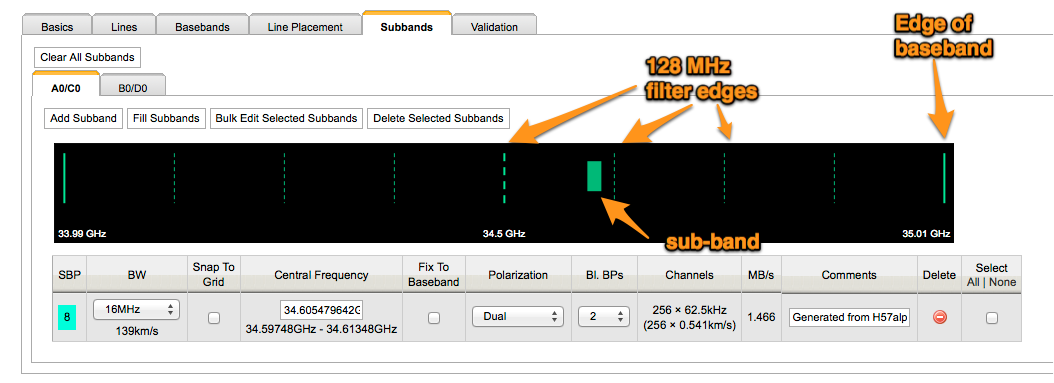
* The sub-bands you generated will show up in the subband tab. Make sure all your line sub-bands have the appropriate properties. The properties of the generated sub-band (including the central frequency) can be changed in this time if they are not appropriate for your science. If you want to change sub-band properties, you need to do it separately for each baseband, i.e., you can't change sub-band properties across all base bands. Remember that you can't place sub-bands across the 128 MHz filter boundaries! If you would like to add continuum sub-bands, hold off for now. It's easier to do this after you're set up doppler setting.[[Image:spectral_line_correlator_subband_window.png]] | * The sub-bands you generated will show up in the subband tab. Make sure all your line sub-bands have the appropriate properties. The properties of the generated sub-band (including the central frequency) can be changed in this time if they are not appropriate for your science. If you want to change sub-band properties, you need to do it separately for each baseband, i.e., you can't change sub-band properties across all base bands. Remember that you can't place sub-bands across the 128 MHz filter boundaries! If you would like to add continuum sub-bands, hold off for now. It's easier to do this after you're set up doppler setting.<p>[[Image:spectral_line_correlator_subband_window.png]]</p> | ||
* If you're getting errors about your sub-bands being too close to baseband boundaries or if you don't like where they are placed in the baseband, go back to the baseband tab and change the center of the baseband to a more appropriate value. This process may take some fiddling. The overview plot and the plot in the sub-band tab can help guide your sub-band placement. | * If you're getting errors about your sub-bands being too close to baseband boundaries or if you don't like where they are placed in the baseband, go back to the baseband tab and change the center of the baseband to a more appropriate value. This process may take some fiddling. The overview plot and the plot in the sub-band tab can help guide your sub-band placement. | ||
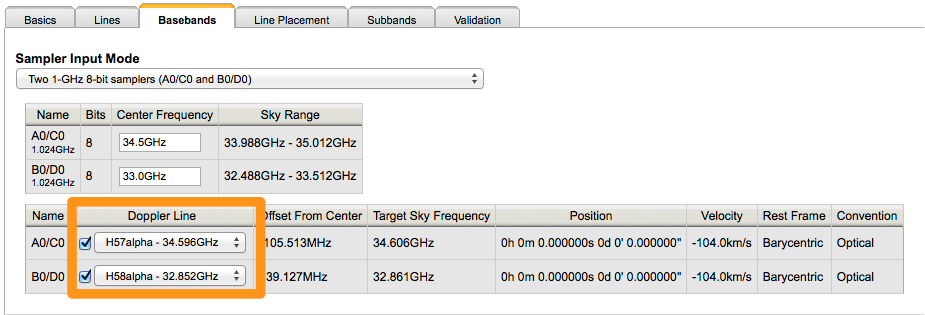
* Once you're happy with the placement of the line | * Once you're happy with the placement of the line sub-bands, you can turn on doppler setting if desired. Technically, the correlator can only do Doppler setting for individual basebands, not individual sub-bands. Therefore, you need to use a line to Doppler set on for each baseband. This line can either be one of your science lines or an imaginary line. The imaginary line can be close to the center of your baseband or the average of your line frequencies depending on what makes the most sense for your data. Consult the NRAO help desk if you have any questions about the best way to Doppler set for your program. <p>[[Image:spectral_line_correlator_doppler.png]] </p> | ||
* Finally, you can go back and add your continuum sub-bands in the sub-bands window. While the narrower sub-bands can be flexibly tuned within the 128 MHz boundaries, the larger spectral windows (e.g., 64 MHz and 128 MHz) have typically fixed placements. You can automatically fill the rest of the baseband with continuum windows by selecting "Fill subbands". To edit the properties of all the sub-bands for each baseband, select the continuum sub-bands, and then select "Bulk Edit Selected Subbands". Remember that you need to do this for each baseband. [[Image:spectral_line_correlator_continuum_windows.png]] | * Finally, you can go back and add your continuum sub-bands in the sub-bands window. While the narrower sub-bands can be flexibly tuned within the 128 MHz boundaries, the larger spectral windows (e.g., 64 MHz and 128 MHz) have typically fixed placements. You can automatically fill the rest of the baseband with continuum windows by selecting "Fill subbands". To edit the properties of all the sub-bands for each baseband, select the continuum sub-bands, and then select "Bulk Edit Selected Subbands". Remember that you need to do this for each baseband. <p>[[Image:spectral_line_correlator_continuum_windows.png]]</p> | ||
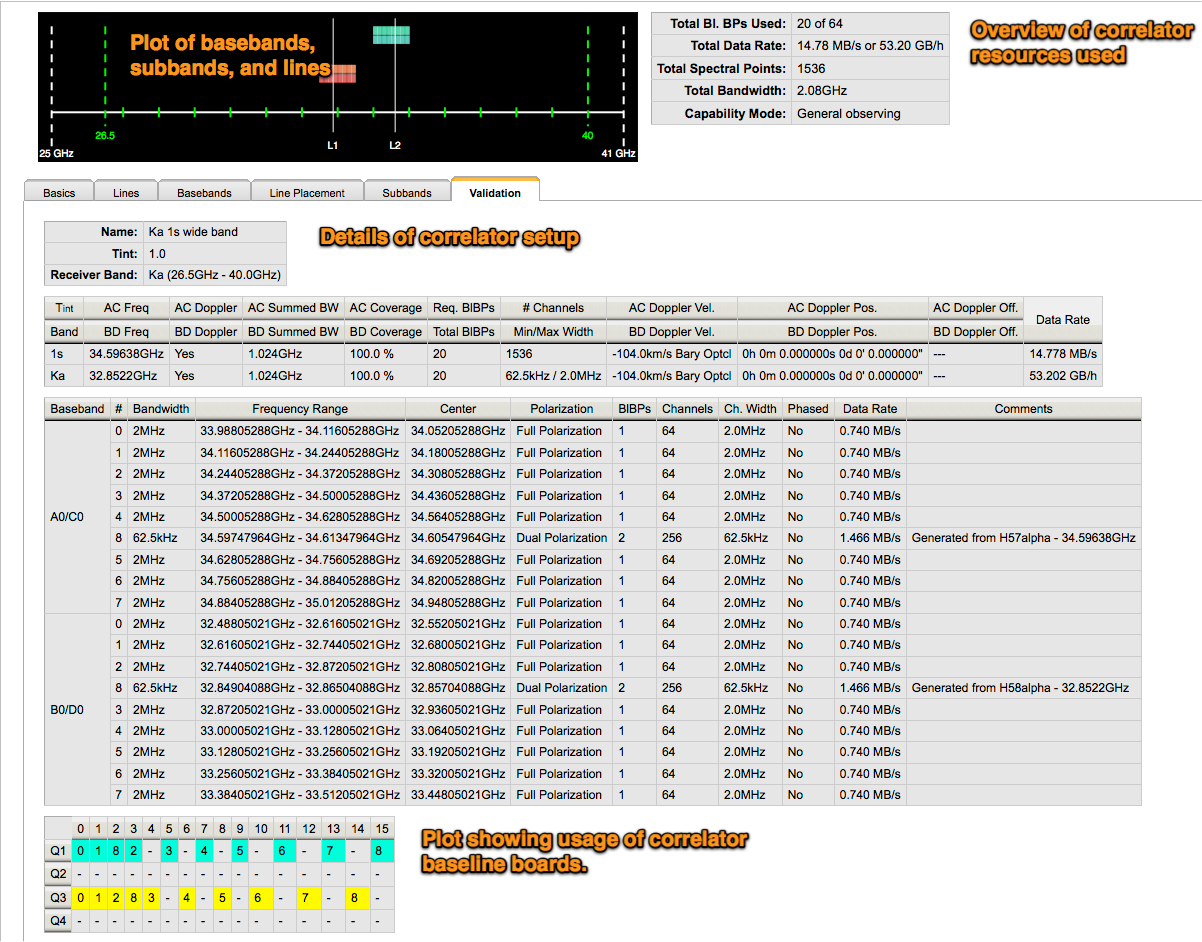
* Once you're happy with your setup, validate it in the validate tab. This tab gives lots of information about the correlator including your data rate, the correlator resources used, where your sub-bands are placed in the baseband, and which baseline boards this configuration will use. It's a good idea to use the data rate to estimate the total data volume for an individual scheduling block and for your entire project. The current VLA produces much more data than the old VLA. Large data files take a long time to download and process. For example, a 32GB data file takes about 8 hours to download over high-level broadband (10Mb/s) and about 1hr of computing time to run through a calibration script using CASA 3.4 on an computer with 12 processors, 24GB of RAM, and 2TB of disk space. Therefore, it is important to minimize your file sizes as much as possible. If you're not a shared risk observer, do not exceed the data rate limit set in the Observational Status Summary. Also make sure to resolve any errors that pop up at the bottom of the screen associated with your configuration. Do not submit a scheduling block with an invalid correlator configuration. [[Image:spectral_line_correlator_validation.png]] | * Once you're happy with your setup, validate it in the validate tab. This tab gives lots of information about the correlator including your data rate, the correlator resources used, where your sub-bands are placed in the baseband, and which baseline boards this configuration will use. It's a good idea to use the data rate to estimate the total data volume for an individual scheduling block and for your entire project. The current VLA produces much more data than the old VLA. Large data files take a long time to download and process. For example, a 32GB data file takes about 8 hours to download over high-level broadband (10Mb/s) and about 1hr of computing time to run through a calibration script using CASA 3.4 on an computer with 12 processors, 24GB of RAM, and 2TB of disk space. Therefore, it is important to minimize your file sizes as much as possible. If you're not a shared risk observer, do not exceed the data rate limit set in the Observational Status Summary. Also make sure to resolve any errors that pop up at the bottom of the screen associated with your configuration. Do not submit a scheduling block with an invalid correlator configuration. <p>[[Image:spectral_line_correlator_validation.png]]</p> | ||
===Configurations for Pointing Scans=== | ===Configurations for Pointing Scans=== | ||
| Line 189: | Line 201: | ||
In 8-bit mode, the VLA requires an initial dummy scan to set the attenuation levels. The dummy scan should have a length of at least 1 minute and should have the same correlator set up as the first "real" scan. At high frequencies where pointing is required (>18 GHz), two dummy scans are required. Each should have a length of at least 1min. The first has the same correlator set up as the first "real" scan and the second has the same correlator set up as the pointing scans. If you have more than one science correlator setup, you need additional dummy scans for each correlator set up. | In 8-bit mode, the VLA requires an initial dummy scan to set the attenuation levels. The dummy scan should have a length of at least 1 minute and should have the same correlator set up as the first "real" scan. At high frequencies where pointing is required (>18 GHz), two dummy scans are required. Each should have a length of at least 1min. The first has the same correlator set up as the first "real" scan and the second has the same correlator set up as the pointing scans. If you have more than one science correlator setup, you need additional dummy scans for each correlator set up. | ||
In 3-bit mode, | In 3-bit mode, you need scans to set-up the attenuators and the gain slopes and scans to set the requantizer gains. The set-up scans for the attenuators need to occur only once at the beginning of a scheduling block. The requantizer gains scans need to occur after every 8-bit to 3-bit transition and every band change in 3-bit. See [https://science.nrao.edu/facilities/vla/docs/manuals/obsguide/modes/set-up/3bit Section 7.1.2] of the Guide to Observing with the VLA document for more details and some examples. | ||
To create a scheduling block, | To create a scheduling block, | ||
| Line 216: | Line 228: | ||
* <p>In the editing window, click on the image tab to see the the elevation and azimuth curves for your source.</p> <p>[[Image:source_image_tab.png]]</p><p>[[Image:source_elevation_plot.png]]</p> | * <p>In the editing window, click on the image tab to see the the elevation and azimuth curves for your source.</p> <p>[[Image:source_image_tab.png]]</p><p>[[Image:source_elevation_plot.png]]</p> | ||
* Note the range of LSTs that your source is at an appropriate elevation/azimuth for observing. | * Note the range of LSTs that your source is at an appropriate elevation/azimuth for observing. A table to the right of the plot shows the rise/set times for different elevations for your source. | ||
Repeat this process for all sources in your scheduling block including calibrators. The appropriate LST start range for your scheduling block is the range of LSTs during which all your science and calibration sources are up for the entire scheduling block. Make sure to take into account the length of your scheduling block. If all your sources are up from 10h to 18h LST and your scheduling block is 4h long, then the appropriate LST start range is 10h to 14h. | Repeat this process for all sources in your scheduling block including calibrators. The appropriate LST start range for your scheduling block is the range of LSTs during which all your science and calibration sources are up for the entire scheduling block. Make sure to take into account the length of your scheduling block. If all your sources are up from 10h to 18h LST and your scheduling block is 4h long, then the appropriate LST start range is 10h to 14h. | ||
| Line 225: | Line 237: | ||
* <p>input the appropriate LST start ranges for your scheduling block making sure to take into account the length of your scheduling block.</p><p>[[Image:lst_start_range.png]]</p> | * <p>input the appropriate LST start ranges for your scheduling block making sure to take into account the length of your scheduling block.</p><p>[[Image:lst_start_range.png]]</p> | ||
You can input multiple LST ranges by clicking the "Add" button under the initial LST range. This is handy for avoiding LST ranges where your source is too high (elevation > 80 degrees). | You can input multiple LST ranges by clicking the "Add" button under the initial LST range. This is handy for avoiding LST ranges where your source is too high (elevation > 80 degrees). You can also ask to avoid sunrise and sunset, which is important for high frequency observations. | ||
One more thing to note in the Information tab is the "Count" entry under the scheduling block name. If you would like a scheduling block to execute multiple times, you can change the count from 1 to your desired number of executions. When submitting a scheduling block with multiple executions, you might consider submitting a block with a count of 1, checking the data after it has run, and then copying and pasting that scheduling block to a new scheduling block with a count greater than 1. Note that you cannot change the count on a scheduling block once it has been executed on the telescope. | One more thing to note in the Information tab is the "Count" entry under the scheduling block name. If you would like a scheduling block to execute multiple times, you can change the count from 1 to your desired number of executions. When submitting a scheduling block with multiple executions, you might consider submitting a block with a count of 1, checking the data after it has run, and then copying and pasting that scheduling block to a new scheduling block with a count greater than 1. Note that you cannot change the count on a scheduling block once it has been executed on the telescope. | ||
| Line 270: | Line 282: | ||
** Have you selected the appropriate scheduling constraints/conditions for your observing frequency? | ** Have you selected the appropriate scheduling constraints/conditions for your observing frequency? | ||
* Report tab: | * Report tab: | ||
** Have you followed all the | ** Have you followed all the VLA observing constraints listed on the [https://science.nrao.edu/facilities/evla/observing/opt OPT webpage] including dummy scans, total time on first source, appropriate first and last sources, and scan lengths? | ||
** Is your scheduling block the correct length (multiple of 15 minutes)? You may need to enter an assumed schedule start time and click on update for the total scheduling block time to be updated. | ** Is your scheduling block the correct length (multiple of 15 minutes)? You may need to enter an assumed schedule start time and click on update for the total scheduling block time to be updated. | ||
** Is your source position correct? | ** Is your source position correct? | ||
| Line 297: | Line 309: | ||
** When stepping through the list of LST start ranges, do your sources have elevations of between 30 and 80 degrees if observing at high frequencies?<br /> | ** When stepping through the list of LST start ranges, do your sources have elevations of between 30 and 80 degrees if observing at high frequencies?<br /> | ||
** When stepping through the list of LST start ranges, do your sources have elevations between 9 degrees and 80 degrees if observing at low frequencies? | ** When stepping through the list of LST start ranges, do your sources have elevations between 9 degrees and 80 degrees if observing at low frequencies? | ||
** Are you in danger of hitting a wrap limit? The cabling inside the antennas has a finite length. This limits the angular distance that the antenna can rotate. When an antenna has rotated the maximum angular distance, it hits a "wrap limit" and has to rotate in the other direction to unwrap the cabling. The unwrapping process is slow and can take a significant amount (~10min) of time. Since the | ** Are you in danger of hitting a wrap limit? The cabling inside the antennas has a finite length. This limits the angular distance that the antenna can rotate. When an antenna has rotated the maximum angular distance, it hits a "wrap limit" and has to rotate in the other direction to unwrap the cabling. The unwrapping process is slow and can take a significant amount (~10min) of time. Since the VLA is dynamically scheduled, it is difficult to know where the antenna will be at the beginning of your scheduling block. To avoid hitting a wrap limit in the middle of your scheduling block, it is advisable to set the antenna wrap direction in the first 4-5 scans using the "antenna wrap" box in the scan information window editing window and assign some extra time to your first "real" scan. Then any unwrap will occur during the beginning of your block. The report tab will inform you whether or not the antenna is wrapping in the middle of a scheduling block. | ||
==Submitting Your Scheduling Block== | ==Submitting Your Scheduling Block== | ||
| Line 305: | Line 317: | ||
To retract a scheduling block after it has been submitted, go to the validation and submission tab for the scheduling block and click "cancel". | To retract a scheduling block after it has been submitted, go to the validation and submission tab for the scheduling block and click "cancel". | ||
Once your scheduling block has been executed, you should receive an email from the | Once your scheduling block has been executed, you should receive an email from the VLA Operator letting you know that the data has been taken and is available in the archive. You and your collaborators can configure your email settings by clicking on the project code on the left than side of the OPT and going to the "Principle Investigator and co-authors" section. The Executions tab on the scheduling block gives you information on when the block was executed. | ||
==About This Document== | ==About This Document== | ||
Latest revision as of 15:00, 24 September 2015
Introduction
Note (1/25/2012): This guide has been updated for the lastest version of the OPT. Please contact Amanda Kepley (akepley@nrao.edu) for comments/questions suggestions about this guide and the NRAO helpdesk for any questions about the OPT.
Note (9/30/2014): This guide no longer reflects the current state of the OPT due to limited support. Please consult the official OPT manual.
The goal of this guide is to provide a brief, practical introduction to using the Observing Preparation Tool (OPT) to create scheduling blocks for the VLA. After reading this guide, you should be able to successfully create a simple VLA scheduling block. Please send any questions, comments, or suggestions about this documentation to Amanda Kepley (akepley@nrao.edu). For questions about the OPT, please contact the NRAO Help Desk via the my.nrao.edu portal.
A scheduling block defines a complete set of VLA observations including your source and all necessary calibration (flux, complex gain, bandpass, etc). If you have experience with the old VLA, a scheduling block is the equivalent of an VLA "observe file" created using JObserve. Your total VLA time allocation may consist of multiple scheduling blocks; these blocks do not have to correspond to the lengths of the blocks in your disposition letter. Most scheduling blocks are scheduled dynamically based on the conditions at the VLA.
This guide assumes that you understand what data is necessary to successfully calibrate your VLA data. If you need a refresher, some helpful resources are:
- Taylor, Carilli, and Perley. 1999, Synthesis Imaging in Radio Astronomy II especially Chapter 5 -- Calibration and Editing and Chapter 11 -- Spectral Line Observing I: Introduction,
- Observational Status Summary, which gives an overview of the VLA including calibration and current restrictions,
- Guide to Observing with the VLA, which gives the details of how to observed with the VLA, and
- the introduction to the VLA calibrator manual, which gives the best practices for calibrating VLA data
This quickstart guide does not include the all current observing restrictions for the VLA. These restrictions are given in VLA observational status summary and Chapter 5 of Guide to Observing with the VLA and change frequently. Make sure you that you read and understand the current restrictions.
The OPT manual gives more detailed information about the OPT. Since the OPT is being actively developed, some images may not be identical to those shown here. There may also be some additional features. However, the overall philosophy and workflow in the OPT should not change. If you need more information about any of the features described in this quick start guide, consult the full OPT manual. If you have questions about the OPT, you can submit a Help Desk ticket via my.nrao.edu.
Overview of the Scheduling Block Creation Process
There are three steps to creating a scheduling block.
- Create a catalog of the sources you would like to observe. This should include your science source(s) and your calibration sources (flux calibrator, bandpass calibrator, complex gain calibrator, etc).
- Configure the VLA receivers and correlator for your proposed observations. An individual VLA receiver and correlator setup is referred to as an instrument configuration.
- Create a scheduling block using the source catalog created in step 1 and the instrument configuration(s) created in step 2.
While completing these steps, keep a copy of your original proposal and your disposition email handy. These documents should have all the information necessary to create your scheduling blocks.
OPT access and layout
To access the OPT,
- Login to my.nrao.edu. Your login should have already been created as part of the proposal application process. If you have forgotten your password, you can use the "Forgot password?" link to obtain your login information.
- Click on the "Obs Prep" tab.
- Click on the "Login to the Observation Preparation Tool" link.
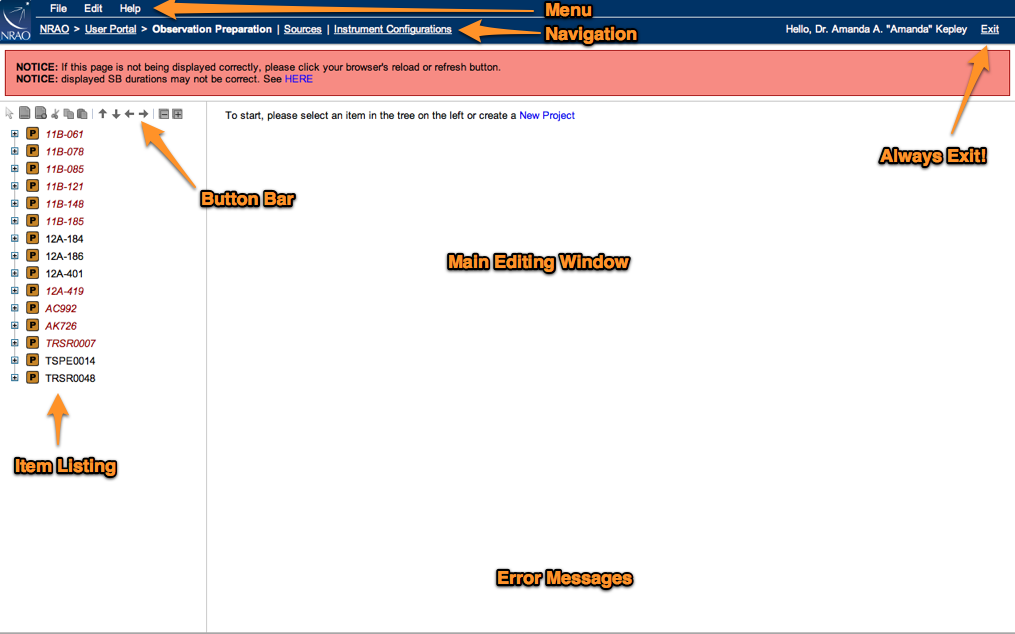
You should now have access to the OPT. The layout of the OPT is shown below.
The different portions of the OPT are labeled in the above image. The Menu and Navigation strips occupy the top two lines of the screen. The Menu strip contains the usual "File", "Edit", and "Help" categories. The "View" menu item allows you to select which projects you would like to be visible in the Observational Preparation part of the tool, which is handy if you've been lucky enough to have many accepted proposals. Below it, the Navigation strip allows you to navigate to the different sections of the OPT:
- the Observation Preparation section where you prepare your scheduling blocks,
- the Sources section where you put together your source lists, and
- the Instrument Configuration section where you set up the receiver(s) and correlator configuration(s).
Any system-wide messages appear in red below the navigation strip. These messages alert users to system downtime, critical bugs, etc.
The item listing is in the left hand column. This list consists of either a list of scheduling blocks, instrument configurations, or source catalogs, depending on which section of the OPT you are in. The button bar above the item listing allow you to modify the item listing (e.g., cut, paste, copy, etc). You can hover the mouse over the different buttons to determine their function. Many of the button bar functions can also be accessed via the "File" and "Edit" menus.
The right hand column is your main editing window. In this window, you will set up scans in your scheduling block, add source information, and edit correlator configurations. Error messages will appear as necessary in the bottom portion of your screen.
The OPT automatically saves your work. You can create your scheduling block in several shorter sessions rather than having to do everything at once.
WARNING: The OPT allows any co-investigator on your proposal to edit and submit scheduling blocks. However, only one individual can edit scheduling blocks at a time. To make sure that other members of your team are able to edit the scheduling blocks for your project, always click on the "EXIT" button in the upper right hand corner of the OPT to leave the OPT rather than just closing your browser window.
Creating a Source List
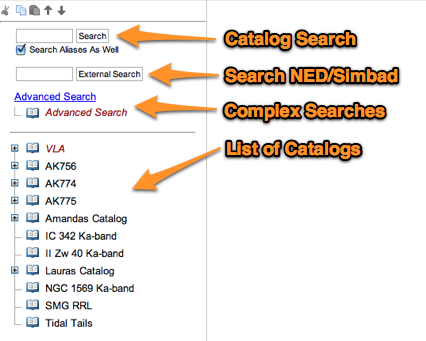
To create a source list, click on "Sources" in the Navigation strip at the top of the screen. The item listing on the left hand side of the OPT will show your source catalogs. An example of this display is shown below. Your list of catalogs will be different from those shown. The only catalog that will be the same will the VLA catalog.
Each catalog contains one or more groups of sources. Groups allow you to organize your source list and make it easier to generate scheduling blocks. For example, you can include the calibrators for your science source in the same group as your science source.
You can also manually add catalogs, groups, and sources using File->Create New. A newly created source only has fields for you to enter the source name and position. Your source names need to be less than 14 characters for your data to be compatible with AIPS.
In addition to science targets, most observations will need three different types of calibration sources: complex gain (i.e., phase) calibrators, flux calibrators, and bandpass calibrators. We will go through the process of selecting these different types of calibrators in the OPT. This will demonstrate both how to select these types of calibrators and the different ways to select sources from catalogs using the OPT.
Warning: Your observations may have different calibration needs than the above. It is your responsibility to make sure that your data will be adequately calibrated.
Adding Your Science Targets
The list of sources from your accepted proposal are automatically imported into a catalog. The name of the catalog is either the legacy ID for your proposal (e.g., AK774) or the new id (e.g., 12B-292). The IDs for your proposal is given on the cover page of your proposal, in the list of submitted proposals in the Proposal Submission Tool at my.nrao.edu, and in your disposition email. You can look at the parameters for or edit the sources in your catalog by clicking on the edit button to the left of the source name in the catalog as shown in the image below. It's a good idea to check the source names, positions, and velocities that have been imported from the PST. You can add a source velocity if your source doesn't have one already by clicking "Add" in the "Source Velocity" section.
Note: You may have been awarded time for only some of your proposed sources. Regardless of the awarded time, all your proposed sources are imported in a catalog, not just those you were awarded time to observe.
If your sources haven't been automatically imported, use the "External Search" box to find your source in NED or SIMBAD. Once you have found the appropriate source, follow the procedure outlined in the next section as to copy and paste it into your catalog.

You can also enter your source manually by selecting your catalog, choosing File->Create New->Source. You will need to fill in the source name, source position, and possibly the source velocities sections of the source editing screen.
Selecting a Complex Gain Calibrator
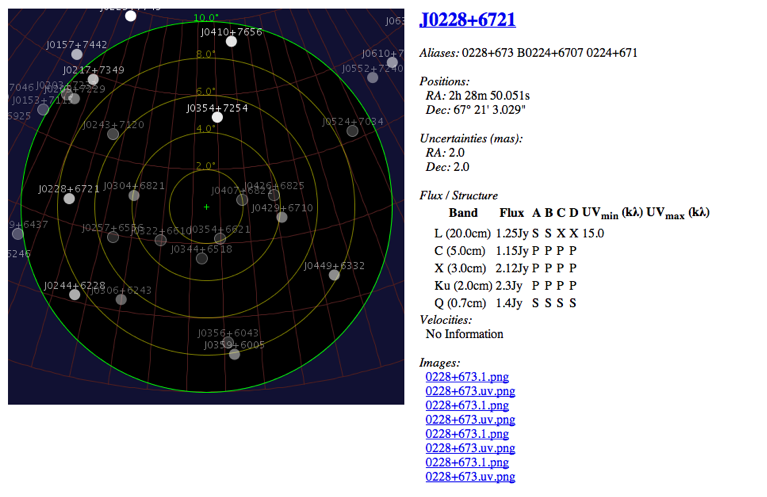
Complex gain calibrators are used to calibrate amplitude and phase as a function of time. They are typically point sources located close (< 10 degrees) to the science source. The easiest way to select a complex gain (i.e., phase) calibrator is to click on the group containing your science source in the catalog for your observing program. To the right of your science source name in the main editing window, there will be a link to a map of the sky around your object (indicated below by an orange circle in the image below). Click on the link.
When you click on the "Sky Map" link, a separate window similar to the following will appear below. The left hand side shows all the calibration sources near your selected source. If you hover your mouse above a particular calibration source, information from the VLA calibrator manual about that source is shown. See the VLA calibrator manual for a key to the catalog listing. Both the VLA calibrator manual and the Guide to Observing with the VLA have tips for selecting complex gain calibrators. Once you're selected a suitable source, write down the name of the source.
Warning: Clicking on the sky map will recenter it at those coordinates. Don't click on the map if you don't want to recenter it.
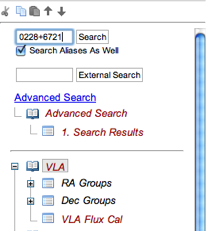
All VLA calibrators shown on the map are listed in the VLA catalog. To add the selected complex gain calibrator to the catalog for your project, search the VLA catalog for that calibrator and then copy and paste the complex gain calibrator information. To do this,
- Select the VLA catalog. This catalog should be at the top of your list of catalogs.
Type the calibrator name in the search box at the top of the item manipulation region.
- Click search. Your desired calibrator should appear in the main editing window.
- Click the check box next to the calibrator.
- Select Edit->Copy->Sources. You can also use the copy button (
 ) in the button bar.
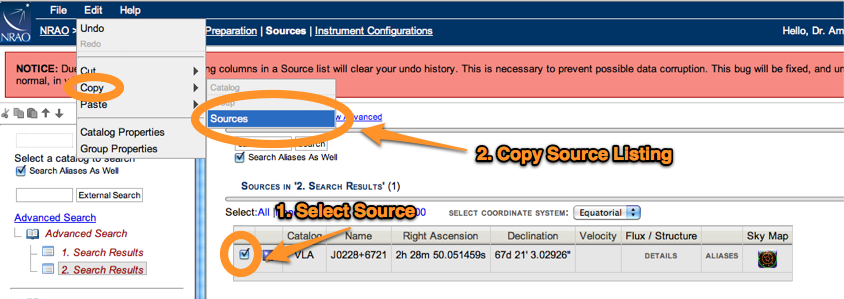
- Select the source catalog for your program.
- Select Edit->Paste->Sources. You can also use the paste button (
 ) in the button bar.
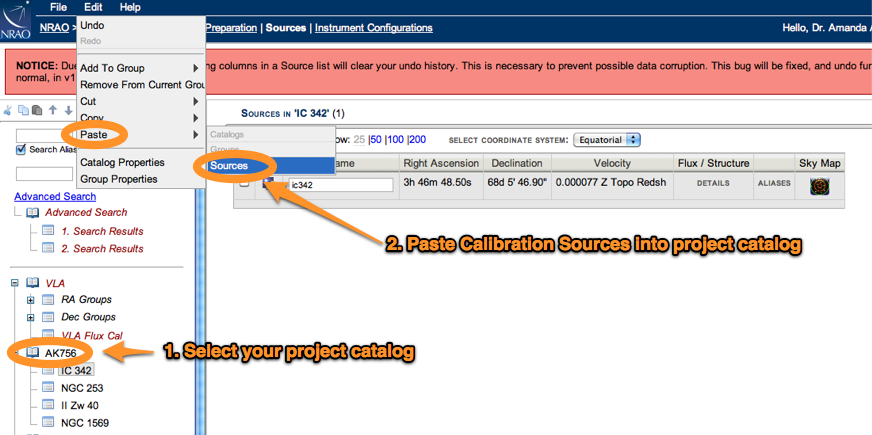
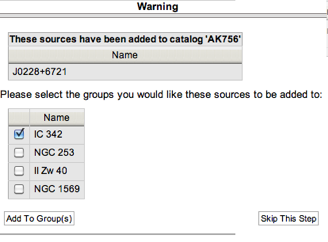
If you have set up source groups, then when you paste your source, the OPT will prompt you to choose the correct group for your calibrator. Select the correct group and click "Add To Group(s)" button. Grouping sources makes the book-keeping easier when creating scheduling blocks. If you want, you can also skip this step by clicking the "Skip This Step" button.
Selecting a Flux Calibrator
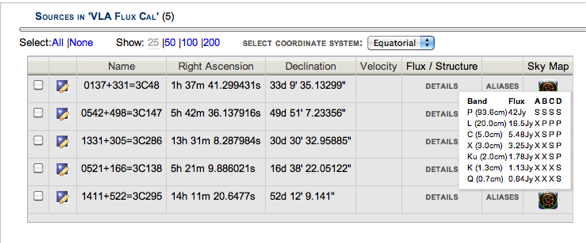
All the flux calibrators for the EVLA are located in the VLA catalog in the group "VLA Flux Cal". If you hover the mouse in the Flux/Structure column for a particular source, you can get the VLA calibrator manual information for that calibrator.
Choose an appropriate flux calibrator for your observations. Then use the copy and paste method detailed in the "Selecting a Complex Gain Calibrator" section to add your flux calibrator to your project catalog.
Selecting a Bandpass Calibrator
Objects like bandpass calibrators, which need to be very bright and up at the same time as your program source, require a more complex catalog search. (Sometimes your flux calibrator can be a suitable bandpass calibrator.) To do this type of search,
- Click on the "Advanced Search" link in the left hand column.
- Select the catalog you want to search. Here, we select the VLA catalog to search the VLA calibrator manual.
- Select the parameters you want to search on.
- Click on the "Search" button at the bottom of the page.
When you've found an appropriate source, you can copy and paste it into your program catalog using the same procedure as for your complex gain calibrator. In the example below, the VLA catalog is being searched for sources brighter than 5.0 Jy in C band with RA's between 0 and 6h and declinations greater than 30 degrees. 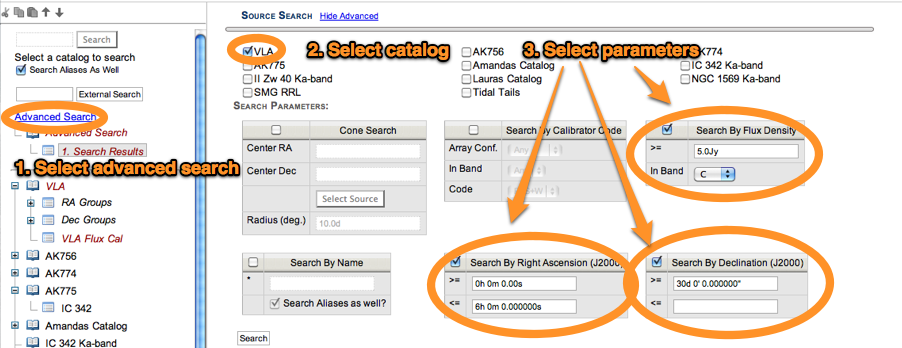
Setting up the Instrument Configuration
Configuring the receivers and correlator properly is one of the most important and difficult aspects of creating a scheduling block. Spectral line users should take extra care to ensure that their correlator set up is correct! Incorrect correlator setups may make doing your proposed science impossible. If you have any questions, please consult the NRAO helpdesk via the my.nrao.edu portal.
The VLA WIDAR correlator is extraordinarily flexible. This quickstart guide only discusses the general correlator modes. Although the interface for configuring the correlator is similar for the shared risk modes, shared risk users should consult VLA staff to create their correlator set up.
Correctly configuring the correlator requires a basic understanding of how the correlator works. There are two modes for the correlator: 3-bit and 8-bit mode. In 8-bit mode, you get two 1-GHz wide baseband pairs. In 3-bit mode, you get four 2-GHz wide baseband pairs. For general observations, you can use 16 sub-bands per baseband pair. The individual sub-band resources can be stacked to provide higher spectral resolution. You can also change the number of channels in an individual sub-band by changing how many polarization products are recorded. If you are not interested in polarization, then dual polarization is a good setting. For both 8-bit and 3-bit observations, the input frequencies for each baseband is divided up into 128MHz chunks that are fed into the correlator. A critical point to remember is that 128 MHz boundaries (AKA 128 MHz suckouts) have reduced sensitivity. Do NOT place lines of interest on the 128 MHz boundaries. See the OPT manual for a more complete description of the correlator modes and Chapter 15 of the Observational Status Summary.
Configuring for "Continuum" Observations
If you observing continuum, there are default continuum configurations available for you to use in the "NRAO Defaults" group. These setups will also work for spectral line work provided that they adequately resolve your line and you don't want to use Doppler setting (see next section). The default continuum configuration group includes both 3-bit and 8-bit configurations. The catalog name is currently "D/Any config 13A". Use the catalog comments to determine which one you want to use. You can use the copy and paste procedure to add one of these configurations to your personal catalog. Currently copying a individual configuration out of a resource group doesn't work. However, you can still copy the setting if you select the entire catalog and then the individual resource. Once you copy and paste the configuration into your personal catalog, you can change the configuration name, the default baseband frequencies and polarization.
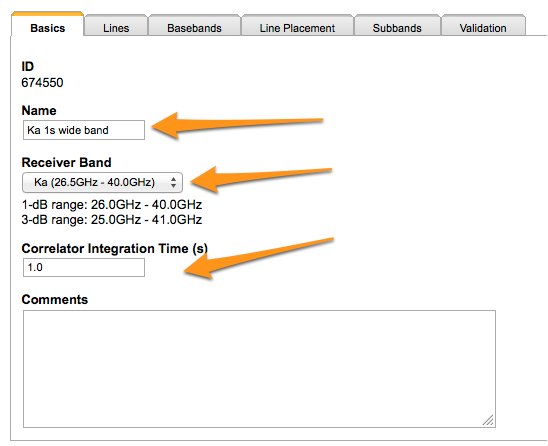
You can change the name of your catalog in the basics tab. Changing it to a unique descriptive name will help with creating and checking scheduling blocks. Please use the default integration time for your observing frequency and configuration. Do not use integration times shorter than the default unless it is necessary for your science. Shorter integration times lead to higher data rates, which is given in the "Correlator Setup" section under the integration time.
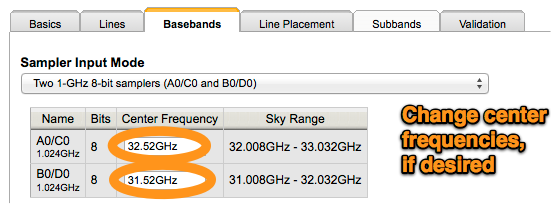
To change your baseband frequency, change the frequency for the center of the baseband in the basebands tab. Do not select Doppler Setting! The plot above should change to show your current baseband tuning. The 3 dB edges of the band are indicated by dotted lines. The green lines show the full sensitivity range of the basebands. If you hover your mouse over a particular baseband, the center frequency of that baseband will be displayed.
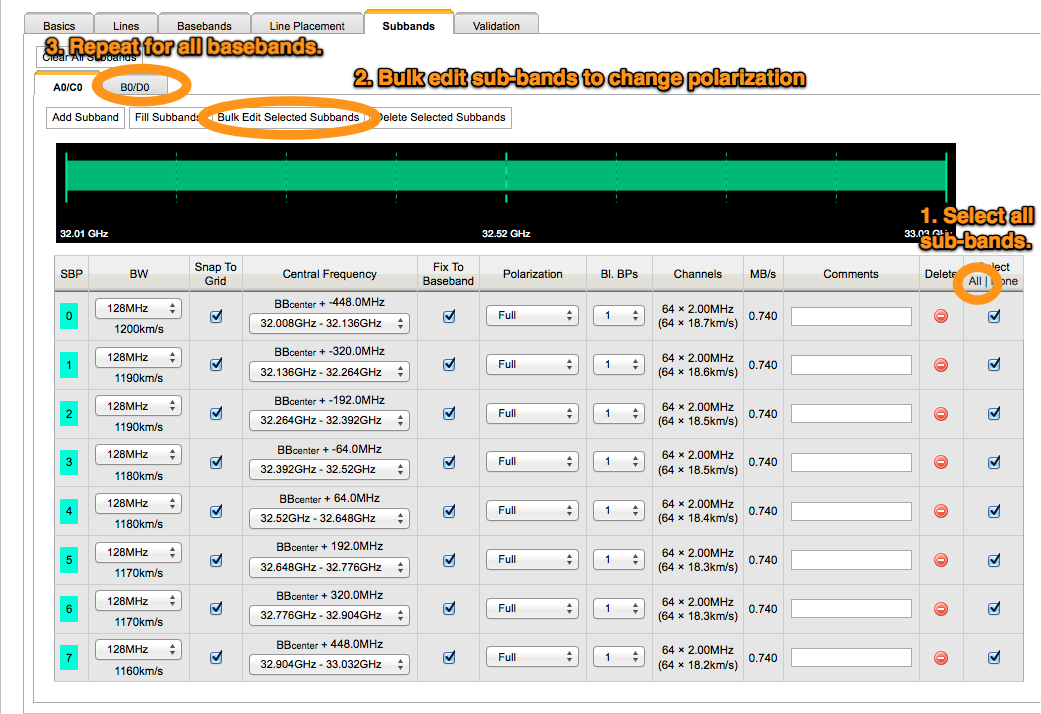
To change the polarization of the sub-bands, go the subbands tab. From there, select all the sub-bands, choose bulk-edit sub-bands, select the desired polarization, and click okay. You need to repeat this for each baseband.
If you're doing spectral line work using the standard "continuum" setups, enter the sky frequency plus an offset equal to half the sub-band width into the "SB Center Freq" boxes. IT IS VERY IMPORTANT THAT YOU DO NOT ENTER THE SKY FREQUENCY INTO THE "SB Center Freq" BOX. IF YOU DO THIS, YOU WILL PLACE YOUR LINE AT THE BOUNDARY OF TWO 128MHz FILTERS WHERE THE SENSITIVITY IS SIGNIFICANTLY DECREASED AND CALIBRATION BECOMES MUCH MORE DIFFICULT. Adding an offset of 1/2 the width of an individual sub-band places your line in the center of a sub-band. You can calculate the sky frequency manually using the dopset tool.
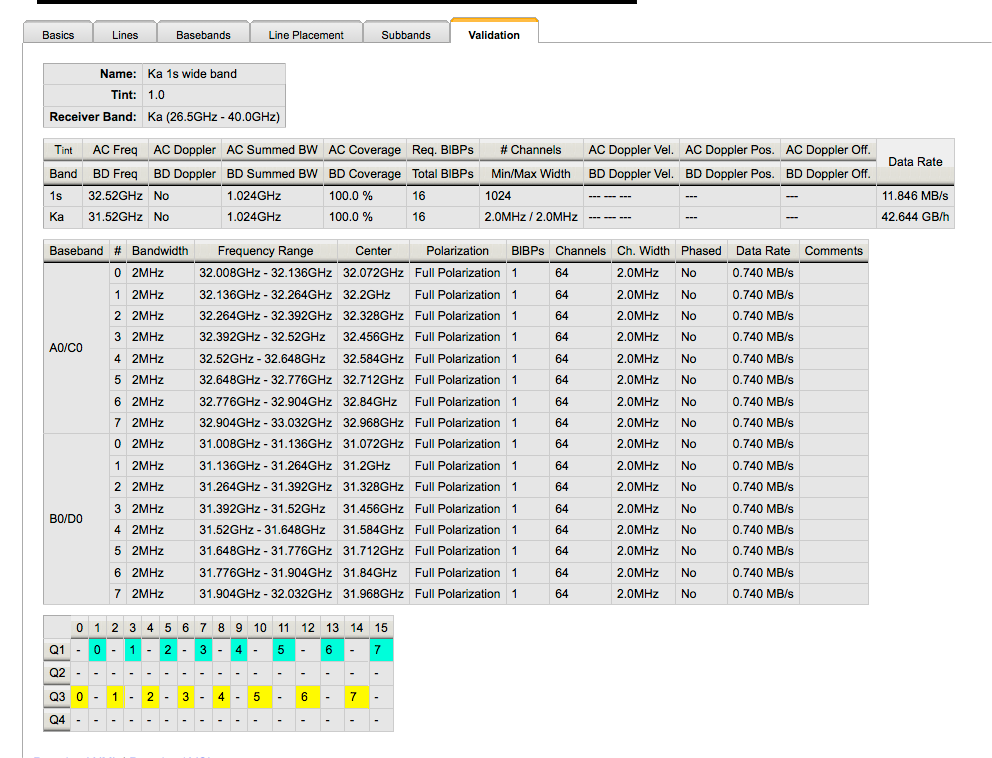
Finally, if you're made any changes validate your correlator setup in the validation tab. This tab gives an overview of the correlator resources you're using and the setup of the correlator.
Configuring for Spectral Line Observations
If you are observing spectral lines, then you need to account for the motion of the Earth and the motion of the source when determining where to place lines (see Chapter 11 of Taylor, Carilli, and Perley. 1999, Synthesis Imaging in Radio Astronomy II for a review of the different velocity systems). The old VLA used "doppler tracking". In doppler tracking mode, the sky frequency was changed for every scan so that the same rest frequency would always be in the same channel. The current VLA does not doppler track. Instead, you can either enter the sky frequency manually or use the doppler setting mode.
Choosing whether to enter the sky frequency manually or to use doppler setting depends on your science and desired correlator settings. If your sub-bands are much wider than 30 km/s, then correction for the motion of the Earth is much smaller than the width of your sub-bands. Therefore, using doppler setting does not get you much and it is best to enter the sky frequency manually. You can account for the change in the sky frequency of the line with time in post-processing using a task like cvel in AIPS or CASA. Where doppler setting comes in handy is with narrower sub-bands (less than a few x 30 km/s). These sub-bands are small enough that the motion of the Earth may shift your line out of the sub-band. Doppler setting allows you to submit one scheduling block and have the line automatically be placed in the right spot. Otherwise, you would have to recalculate the sky frequency manually every few weeks and resubmit your scheduling block to account for the motion of the Earth. Note that doppler setting is more difficult to set up in the correlator (most of this complexity is hidden from the end user).
To enter the sky frequency manually, you can use the dopset tool (http://www.vla.nrao.edu/astro/guides/dopset/) to calculate the sky frequency of your line. You need to enter the source position, the source velocity, the rest frequency of the line, and the observation date and time. The webpage then returns the appropriate sky frequency to enter into the instrument configuration editor. To get the LST day numbers, you can consult the monthly EVLA schedule. The LST days are given to the right of the schedule grid. To get the LST day numbers more than a month in advance, you can extrapolate from this schedule.
Doppler setting mode is configured using the instrument configuration editor. In doppler setting mode, the appropriate sky frequency is automatically calculated once at the beginning of the scheduling block. However, unlike doppler tracking mode, the sky frequency is the same throughout the entire observation; it does not change with every scan.
The process for configuring the WIDAR correlator for spectral line observations is iterative. The basic idea is to get the receiver and spectral windows containing lines set up, then go back and set the frequencies for the centers of each baseband, doppler setting (if desired), and any continuum windows.
To set up your spectral line configuration:
- Create a new spectral line resource catalog by selecting File->Create New->Catalog.
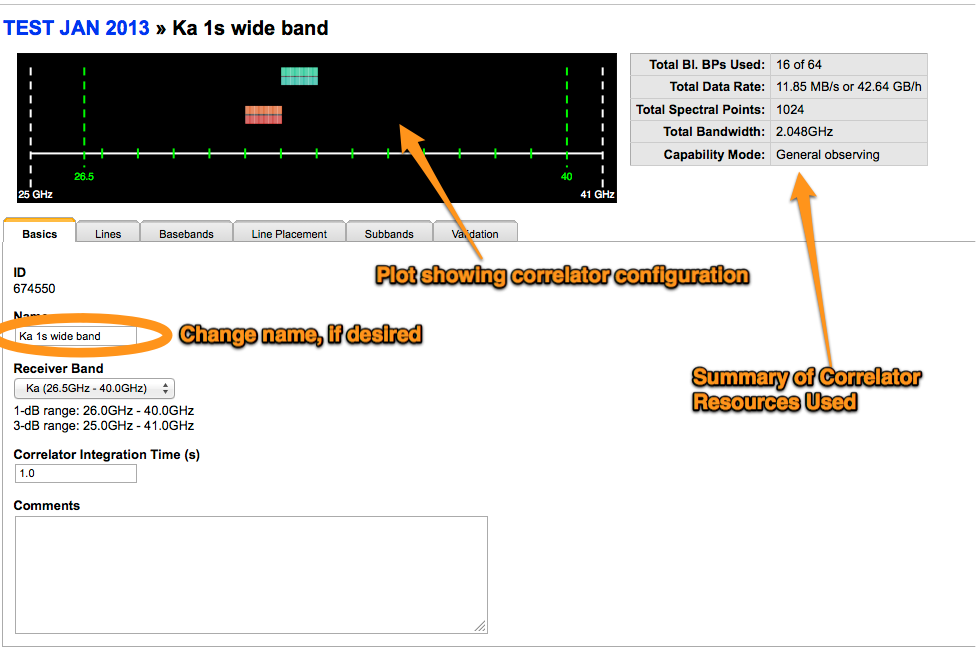
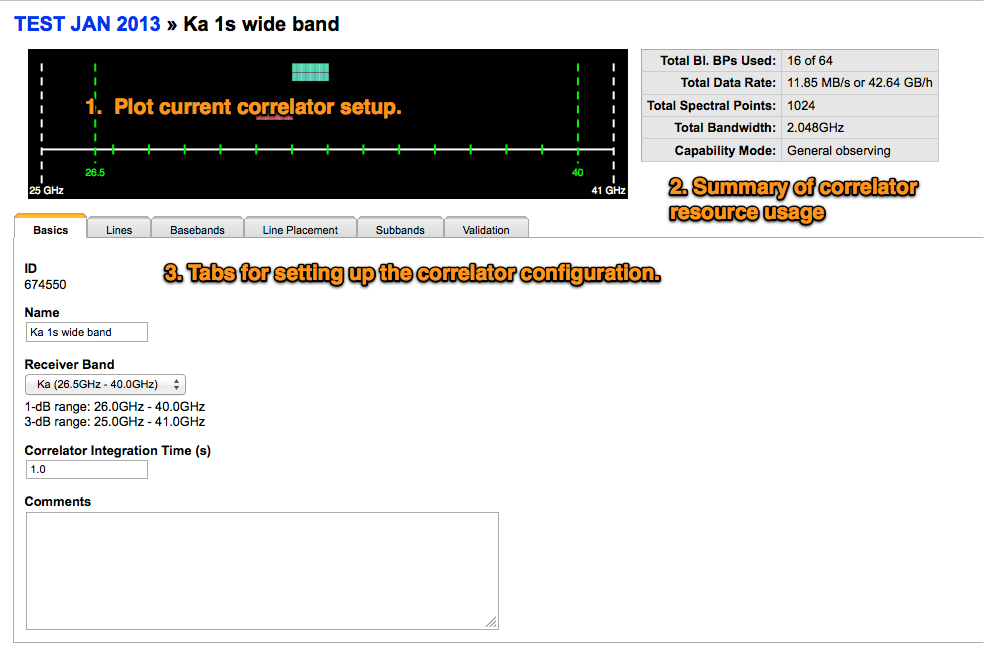
- Create a new spectral line resource by selecting File->Create New->8-bit Instrument configuration. General spectral line observations that need more than the standard 3-bit continuum configuration are currently required to use 8-bit mode. A new instrument configuration window should pop up. The window has three parts: 1) a plot showing the current correlator configuration, 2) a table showing the correlator resources used, and 3) a series of tabs for configuring the correlator. In the plot, the 3 dB edges of the band are indicated by dotted lines. The green lines show the full sensitivity range of the band. If you hover your mouse over a particular baseband, the center frequency of that baseband will be displayed
- The first tab you should see is the basics tab. Here you can name your configuration, select the receiver, and desired integration time. Please use the default integration time for your observing frequency and configuration. Do not use integration times shorter than the default unless it is necessary for your science. Shorter integration times lead to higher data rates, which is given in the "Correlator Setup" section under the integration time.
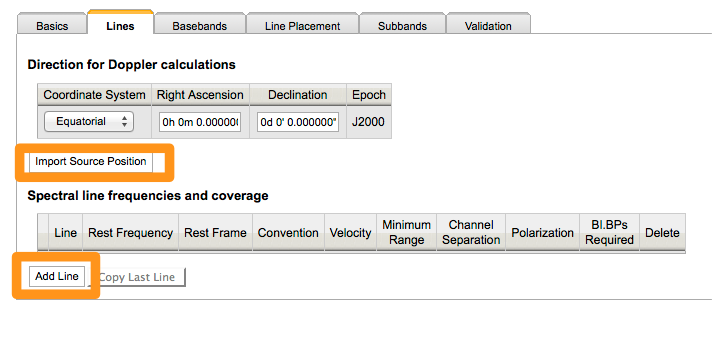
- Next go to the lines tab. In this tab, enter the information on the source and spectral lines you would line to observe. You can import source information from the catalog you created earlier to avoid having to retype things and introduce new errors. When you have multiple lines, copying the previous spectral line prevents you from having to re-enter defaults like the velocity definition and source velocity. The spectral line information is used generate sub-bands of the appropriate bandwidth and channel resolution to observe that line. You can change the bandwidth and channel resolution for the individual line sub-bands later on in the sub-band configuration tab. The lines that you've added will show up in the overview plot above the tabs.
- Now on to the basebands tab! In this tab, center the basebands approximately where you want them, but do not select Doppler Setting yet. It's easier to set up the sub-bands before Doppler Setting has been activated. The base bands should roughly overlap your lines.
- It's time for the fun part -- generating your spectral windows. To do this, go to the line placement tab, select the desired line, and click generate. The pop-up dialog box will ask you which baseband you want to add it to. If your line is already in a particular baseband, it should select that baseband automatically. Select the appropriate baseband (if not already selected) and click Okay. If you click generate multiple times you will get multiple windows. You can just delete the extra windows in the sub-band configuration window. As they are generated, the sub-bands will show up in the overview plot.
- The sub-bands you generated will show up in the subband tab. Make sure all your line sub-bands have the appropriate properties. The properties of the generated sub-band (including the central frequency) can be changed in this time if they are not appropriate for your science. If you want to change sub-band properties, you need to do it separately for each baseband, i.e., you can't change sub-band properties across all base bands. Remember that you can't place sub-bands across the 128 MHz filter boundaries! If you would like to add continuum sub-bands, hold off for now. It's easier to do this after you're set up doppler setting.
- If you're getting errors about your sub-bands being too close to baseband boundaries or if you don't like where they are placed in the baseband, go back to the baseband tab and change the center of the baseband to a more appropriate value. This process may take some fiddling. The overview plot and the plot in the sub-band tab can help guide your sub-band placement.
- Once you're happy with the placement of the line sub-bands, you can turn on doppler setting if desired. Technically, the correlator can only do Doppler setting for individual basebands, not individual sub-bands. Therefore, you need to use a line to Doppler set on for each baseband. This line can either be one of your science lines or an imaginary line. The imaginary line can be close to the center of your baseband or the average of your line frequencies depending on what makes the most sense for your data. Consult the NRAO help desk if you have any questions about the best way to Doppler set for your program.
- Finally, you can go back and add your continuum sub-bands in the sub-bands window. While the narrower sub-bands can be flexibly tuned within the 128 MHz boundaries, the larger spectral windows (e.g., 64 MHz and 128 MHz) have typically fixed placements. You can automatically fill the rest of the baseband with continuum windows by selecting "Fill subbands". To edit the properties of all the sub-bands for each baseband, select the continuum sub-bands, and then select "Bulk Edit Selected Subbands". Remember that you need to do this for each baseband.
- Once you're happy with your setup, validate it in the validate tab. This tab gives lots of information about the correlator including your data rate, the correlator resources used, where your sub-bands are placed in the baseband, and which baseline boards this configuration will use. It's a good idea to use the data rate to estimate the total data volume for an individual scheduling block and for your entire project. The current VLA produces much more data than the old VLA. Large data files take a long time to download and process. For example, a 32GB data file takes about 8 hours to download over high-level broadband (10Mb/s) and about 1hr of computing time to run through a calibration script using CASA 3.4 on an computer with 12 processors, 24GB of RAM, and 2TB of disk space. Therefore, it is important to minimize your file sizes as much as possible. If you're not a shared risk observer, do not exceed the data rate limit set in the Observational Status Summary. Also make sure to resolve any errors that pop up at the bottom of the screen associated with your configuration. Do not submit a scheduling block with an invalid correlator configuration.
Configurations for Pointing Scans
At high frequencies, you need to periodically obtain pointing solutions. These pointing solutions are typically obtained at C or X band. There is a NRAO-provided catalog of the default pointing setups. To access this catalog,
- Go to the "Instrument Configuration" section of the OPT.
- Click on the "NRAO Defaults" catalog on the left hand side of the screen.
Click on the "Pointing setups" group in the left hand side of the screen.
To aid in creating your scheduling block, it's useful to copy and paste the desired pointing setup into your personal instrument configuration catalog using the copy and paste method outlined in the calibrator selection section.
Putting It All Together: Creating a Scheduling Block
Before creating your scheduling block, please see the Guide to Observing with the VLA for the latest VLA observing restrictions. These restrictions change frequently, so check back often to make sure you have the latest information.
The most basic restriction on your scheduling block is its length. The length of your scheduling block needs to be a multiple of 15min. Your scheduling blocks do not need to be the same length as the blocks listed in the email from the schedsoc committee. They can be as long or as short as necessary. Longer blocks (>4 hrs) may have significant changes in observing conditions, while shorter blocks (<2 hrs) require higher overhead to obtain adequate calibration observations. To choose an appropriate scheduling block length, you need to balance your project's scientific needs and its science rating with your allocated VLA time as a function of LST. Projects with lower ratings in popular LST ranges may want to schedule in shorter blocks to increase the probability that they are observed. The schedsoc page includes a link to the VLA pressure histogram for your observing semester.
In 8-bit mode, the VLA requires an initial dummy scan to set the attenuation levels. The dummy scan should have a length of at least 1 minute and should have the same correlator set up as the first "real" scan. At high frequencies where pointing is required (>18 GHz), two dummy scans are required. Each should have a length of at least 1min. The first has the same correlator set up as the first "real" scan and the second has the same correlator set up as the pointing scans. If you have more than one science correlator setup, you need additional dummy scans for each correlator set up.
In 3-bit mode, you need scans to set-up the attenuators and the gain slopes and scans to set the requantizer gains. The set-up scans for the attenuators need to occur only once at the beginning of a scheduling block. The requantizer gains scans need to occur after every 8-bit to 3-bit transition and every band change in 3-bit. See Section 7.1.2 of the Guide to Observing with the VLA document for more details and some examples.
To create a scheduling block,
- Click on the "Observation Preparation" link in the navigation strip at the top of the screen.
- In the item listing on the left hand side of the OPT, click on the "+" side to the left of the project code for your proposal. Project codes are designated with an light brown box with a P inside it and have a format like 12A-186, (
 ). The code is listed on your proposal cover sheet and on the submitted proposals list in the Proposal Submission Tool.
 - In the level below the project code level, click on the plus sign to the left of project code to see the configurations for which you have be awarded time. These are referred to as program blocks and are designated by a blue box with the letters PB inside (
 ). The configuration for the program block will be indicated by a letter to the right of the icon. If your project can be observed in any configuration, you don't need to click on the relevant configuration to start to create a scheduling block.
 - Finally, in the level below the program block level, click on the "+" sign next to the relevant configuration to start creating a scheduling block. Scheduling blocks are designated by a green box with the letters "SB" inside it (
 ). There should already be a scheduling block stub available. If you want to create a new scheduling block, go to File->Create New->Scheduling Block.
The item listing on left hand side of the OPT display should now look similar to following:

The top level is the project code level, the next level down is the program block level, and the final level is the scheduling block level.
The first page you will see after you have created a new scheduling block is the 'Information' tab. There are three items you will likely change on this page:
- the name of the scheduling block,
- the LST start range, and
- the scheduling constraints/conditions.
The name of the scheduling block and the scheduling constraints/conditions boxes are self-explanatory. The LST start range is a little more subtle. To determine the LST start range for your scheduling block,
- Click on the "Sources" link in the navigation section of the OPT.
- Click on the catalog with your program sources in it.
Click on the edit button for one of the source(s) that you will be observing in your scheduling block.
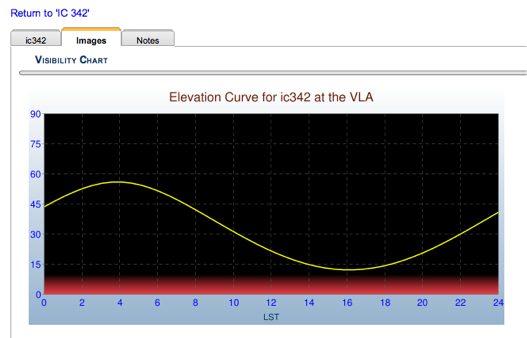
In the editing window, click on the image tab to see the the elevation and azimuth curves for your source.
- Note the range of LSTs that your source is at an appropriate elevation/azimuth for observing. A table to the right of the plot shows the rise/set times for different elevations for your source.
Repeat this process for all sources in your scheduling block including calibrators. The appropriate LST start range for your scheduling block is the range of LSTs during which all your science and calibration sources are up for the entire scheduling block. Make sure to take into account the length of your scheduling block. If all your sources are up from 10h to 18h LST and your scheduling block is 4h long, then the appropriate LST start range is 10h to 14h.
Now go back to your scheduling block in the "Observation Preparation" section of the OPT. In the information tab for your scheduling block,
- uncheck the box for "no constraint"
input the appropriate LST start ranges for your scheduling block making sure to take into account the length of your scheduling block.
You can input multiple LST ranges by clicking the "Add" button under the initial LST range. This is handy for avoiding LST ranges where your source is too high (elevation > 80 degrees). You can also ask to avoid sunrise and sunset, which is important for high frequency observations.
One more thing to note in the Information tab is the "Count" entry under the scheduling block name. If you would like a scheduling block to execute multiple times, you can change the count from 1 to your desired number of executions. When submitting a scheduling block with multiple executions, you might consider submitting a block with a count of 1, checking the data after it has run, and then copying and pasting that scheduling block to a new scheduling block with a count greater than 1. Note that you cannot change the count on a scheduling block once it has been executed on the telescope.
Now that you have filled in the information tab, you are ready to add scans to your scheduling block. You can either create individual scans or you can create a number of scans at one time. To create an individual scan, click on the scheduling block and go to File->Create New-> Scan. Once you have created a scan, you should see something like the following:
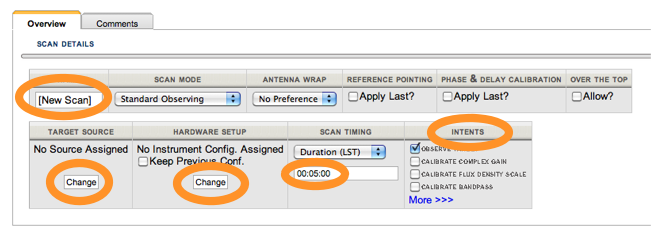
The values that you most likely will want to change are shown in orange. Most of the values are self-explanatory. For the Target Source and Hardware Setup, you should click "Change" and then navigate to the appropriate catalogs and select the desired source or instrument configuration. You also should change the "intents" value to reflect the purpose of the scan. This will help with pipeline processing. If you are doing reference pointing, you should select "Interferometric pointing" under Scan Mode for pointing scans and select "Apply Last?" under Reference Pointing for source scans.
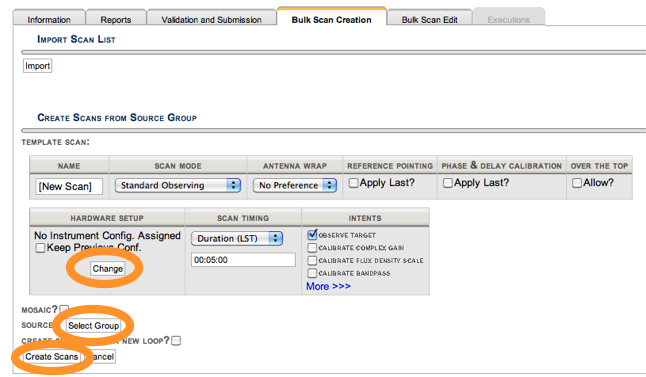
The "Bulk Scan Creation" allows you to create multiple scans with similar properties in one step. For example, if you have a group of sources that all have the same instrument configuration, you could use the "Bulk Scan Creation" tool to create multiple scans each with a different source but the same instrument configuration. This allows you to avoid having to create a new scan for each source, which could be very time-consuming depending on the number of sources. Another use of "Bulk Scan Creation" might be to import different mosaic pointings, but give them the same duration, scan intent, and instrument configuration.
To use "Bulk Scan Creation",
- click on the "Bulk Scan Creation" tab.
- Fill in the desired values in the "Create Scans From Source Group" section. The most likely of these are the Hardware setup and the Source group which are circled below in orange.
- Click on create scans.
Edit the individual scans as needed.
Once you have created all the necessary scans for your scheduling block, you can arrange them using either the cut and paste buttons or the arrow buttons at in the button bar to move scans around. The plus and minus buttons allow you to expand and collapse the scheduling block structure.
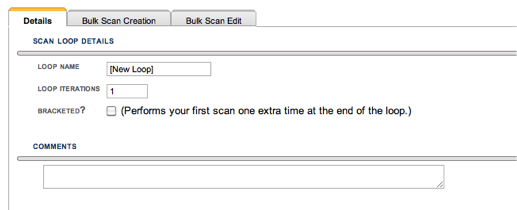
Scan loops are a useful way to repeat groups of observations. For example, you could put your science source and complex gain calibrator in a loop. Then you only need to create two scans and a loop rather than 2 times n scans. Unlike the old VLA, a scan loop for the VLA does not have any additional overhead. To create a scan loop, go to File->Create New->Scan Loop. You have a choice of where to put the scan loop (before or after a scan or possibly in another scan loop). If you click on the scan loop, you should see a screen similar to the following where you can set the properties of the scan loop.
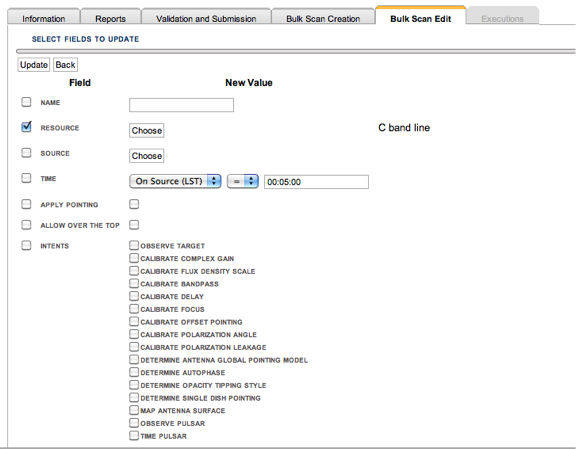
If you want to change many scans at once, the "Bulk Scan Edit" option is very handy. To bulk edit scans, go to the "Bulk Scan Edit" tab in either the top level of a scheduling block or the top level of a loop. The bulk edit will only affect the scans in the structure that you are in. For example, if you click on "Bulk Scan Edit" in a loop, you will only bulk edit scans in that loop. If you click on "Bulk Scan Edit" in the top level of your scheduling block, it will bulk edit all the scans in your scheduling block. When you select the "Bulk Scan Edit" tab, you will see something like the following: 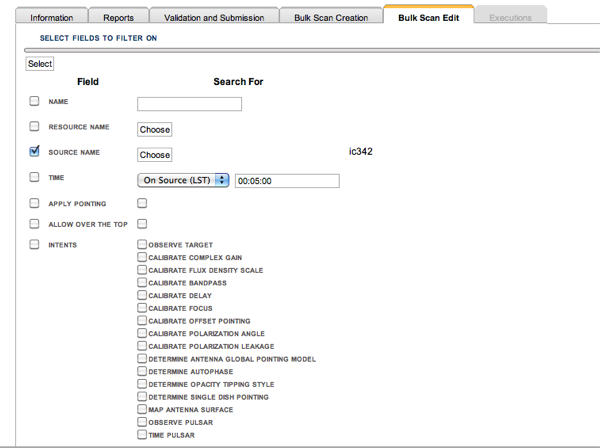
To bulk edit scans,
- Click on the fields that you would like to select on. In the example above, we have selected on the source name.
- Click select.
Now click on the fields that you could like to change. In the example below, we have decided to change the resource used for this source.
- Now click "Update"
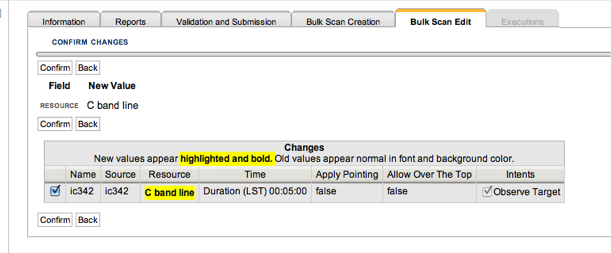
A list of the changes that will be made will appear in the editing window. Click confirm to accept this changes and back to make further change to your selecting and editing parameters.
Warning: If you change one of your source catalog entries or instrument configurations in their respective sections, these changes do NOT automatically propagate to your scheduling block. You should bulk edit the affected scans in the observing preparation section of the OPT to update their source information or instrument configuration. The old and new sources and/or instrument configurations may have the same name. However, giving different names to the new sources and instrument configurations will help when double-checking your scheduling block.
Checking Your Scheduling Block
Congratulations on creating a scheduling block! Your scheduling block is automatically saved. If you decide to exit the OPT before submitting your scheduling block, the draft scheduling block will still be in the OPT when you return.
Before submitting your scheduling block, you should double-check and triple-check it to ensure that it is correct. Since your script will be run by the operator, there is no chance to change things once your scheduling block is on the telescope. The Report tab on the top level of your scheduling block contains a wealth of information on your scheduling block. We list some important items to check for the scheduling blocks below. If you have any questions about your scheduling block, please contact the NRAO helpdesk via the my.nrao.edu portal.
- Information tab:
- Is your LST start range appropriate? The easiest way to test this is use the "Assumed schedule start" field in the "Report" tab. You should step through the range of acceptable LST start times in half hour increments. Check that your sources are high enough and that you have enough time on source for each LST.
- Have you selected the appropriate scheduling constraints/conditions for your observing frequency?
- Report tab:
- Have you followed all the VLA observing constraints listed on the OPT webpage including dummy scans, total time on first source, appropriate first and last sources, and scan lengths?
- Is your scheduling block the correct length (multiple of 15 minutes)? You may need to enter an assumed schedule start time and click on update for the total scheduling block time to be updated.
- Is your source position correct?
- Is the position in the correct coordinate system (J2000 vs. B1950)?
- Is your source velocity correct?
- Is the source velocity in the correct coordinate system?
- Is your correlator configuration correct?
- Do you have an appropriate integration time?
- Have you selected the correct frequency?
- Have you selected "sky" vs. "rest" frequency as appropriate?
- Did you avoid placing your lines on sub-band edges? To see the frequency range and center frequency of each sub-band, select "Show all sub-bands" in the "Instrument Configuration" section.
- Is your total bandwidth correct?
- Is your channel width correct?
- Is your number of polarization products correct?
- Do you have the correct amount of time on source for all sources?
- Do your sources have the right instrument configurations associated with them?
- Are the scan intents set correctly for each source?
- At high frequencies, have you applied the reference pointing results to your source scans?
- Have you included all the appropriate calibration data (flux calibrator, complex gain calibrator, bandpass calibrator, etc)?
- Do you have enough time on the calibrator sources?
- Are your calibration sources bright enough?
- Is your complex gain calibrator approximately a point source at your observing frequency? This information is given in the VLA calibrator manual as the "calcode". See the VLA calibrator manualfor more details.
- Do your polarization calibration sources have the appropriate polarization properties at your observing frequencies?
- When stepping through the list of LST start ranges, do you have enough time on source for all scans (especially pointing and calibration scans)?
- When stepping through the list of LST start ranges, do you have any antenna shadowing warnings? Antenna shadowing occurs when one antenna blocks light going toward a second antenna. It is especially common in compact configurations for low declination sources. If a significant fraction of your antennas are shadowed for a particular LST start time, you may want to consider excluding that time from the range of acceptable LST start times. Shadowed antennas can be flagged.
- When stepping through the list of LST start ranges, do your sources have elevations of between 30 and 80 degrees if observing at high frequencies?
- When stepping through the list of LST start ranges, do your sources have elevations between 9 degrees and 80 degrees if observing at low frequencies?
- Are you in danger of hitting a wrap limit? The cabling inside the antennas has a finite length. This limits the angular distance that the antenna can rotate. When an antenna has rotated the maximum angular distance, it hits a "wrap limit" and has to rotate in the other direction to unwrap the cabling. The unwrapping process is slow and can take a significant amount (~10min) of time. Since the VLA is dynamically scheduled, it is difficult to know where the antenna will be at the beginning of your scheduling block. To avoid hitting a wrap limit in the middle of your scheduling block, it is advisable to set the antenna wrap direction in the first 4-5 scans using the "antenna wrap" box in the scan information window editing window and assign some extra time to your first "real" scan. Then any unwrap will occur during the beginning of your block. The report tab will inform you whether or not the antenna is wrapping in the middle of a scheduling block.
Submitting Your Scheduling Block
To submit a scheduling block, click on the validation and submission tab in the "Observation Preparation" section. First, you need to validate the scheduling block. Once the scheduling block has been validated then you can submit it using the submit button at the bottom of the page. You can request help with your submission using the link to the NRAO helpdesk in the middle of the page.
To retract a scheduling block after it has been submitted, go to the validation and submission tab for the scheduling block and click "cancel".
Once your scheduling block has been executed, you should receive an email from the VLA Operator letting you know that the data has been taken and is available in the archive. You and your collaborators can configure your email settings by clicking on the project code on the left than side of the OPT and going to the "Principle Investigator and co-authors" section. The Executions tab on the scheduling block gives you information on when the block was executed.
About This Document
This document was originally created in Evernote, exported as HTML, and converted to mediawiki format using the Perl module HTML::WikiConverter. The illustrations were created using Skitch.
--Amanda Kepley 13:01, 22 January 2013 (PST)
This category currently contains no pages or media.
